Information on persistent disadvantage is patchy
As yet there are no formal measures established to track trends in the four mana set out in Section 2. However, the work of Stats NZ, the Ministry of Social Development and the Office of Children’s Commissioner can give some insight. More recently the Government passed the Child Poverty Reduction Act 2018, and in 2019 published a Child and Youth Wellbeing Strategy. These initiatives mandate more relevant reporting.
Despite this work, there is no clear picture of who faces persistent disadvantage. There are five main methodological challenges.
- The unit of analysis varies. For some, disadvantage occurs at an individual level, for others it may be the household unit, wider whānau unit, or even their community. Current data cannot capture this richness.
- Not all the four mana have clear, agreed definitions yet, but some initial work has mapped the facets of each mana against existing measures (McMeeking, 2019). There are various definitions of income poverty and material hardship (the lack of certain “essentials” needed to participate in modern society). However, there is no clear line below which a sense of identity is considered “insufficient”. Instead, there is a spectrum, and strengths in some mana can buffer against weaknesses in others.
- Information comes from different surveys, so there are data on how people rate in each of the four mana but there are not data on how the different mana interact. For example, a person might have low income but a strong sense of identity and strong whānau connections, and so not consider themselves disadvantaged overall.
- The same people are not surveyed over time, so there is no information on how persistent disadvantage is (ie, we lack longitudinal data). This makes it difficult to know which people move out of disadvantage versus those that remain stuck, and why.
To meet the requirements of the Child Poverty Reduction Act, Stats NZ is making changes to the way it collects some information on disadvantage. The Living in Aotearoa survey will run a rotating six-year panel, giving some information on the persistence of income poverty and material hardship. First results will be reported in 2025.
New Zealand historical context
This section describes some broad trends on persistent disadvantage for New Zealand. It mostly focuses on income because that is where the best data exist. This section does not aim to provide a comprehensive picture of the evidence. As part of this inquiry, the Commission will produce a summary of the evidence and welcomes input on what issues to include in that narrative.
Colonisation dislocated Māori
From the second part of the 19th century, including the New Zealand Wars and continuing into the 20th century, Māori were systematically dispossessed of their land and other resources, and suffered significant losses to their population, language, culture, authority, wealth and wellbeing. This loss of resources has led to intergenerational cycles of disadvantage for many whānau. Past governments have been unable to break these cycles, in part because services have been designed and delivered from a western perspective.
Poverty and inequality rose sharply in the late 80s and early 90s
Most of the historical data we have is on incomes. The big shift in income inequality happened in the reform period of the late 1980s and early 1990s. During this period, those on the lowest incomes saw their incomes fall (especially through higher unemployment, benefit cuts and downward pressure on wages) while higher incomes held stable. Poverty and child poverty rates also increased, although by how much depends on the measure (as median incomes also fell during this period).
Since then, income growth has been relatively evenly spread
Since the mid-1990s, income growth in New Zealand appears to have been relatively evenly spread (Perry, 2019). As a result of this, the level of income inequality and poverty has persisted at the level reached in the 1990s.
This sets the recent New Zealand experience apart
Much of the public debate around trends in disadvantage draws on the experience from overseas, particularly the United States and the United Kingdom. In the United States incomes of middle-class families have stagnated while those at the top continue to grow. The United Kingdom has faced a similar trend, though not as stark. As discussed above, since the mid-1990s the New Zealand experience has differed in some ways from the United States and United Kingdom. This highlights the need to develop a clear, cohesive narrative about inequality and persistent disadvantage in New Zealand, distinct from those overseas.
New Zealand is an outlier when it comes to housing
The major caveat to this story on poverty and inequality is the cost of housing. When housing costs are taken into account, poverty levels have continued to creep up in recent decades. The numbers of working age households spending more than 30% of their income on housing (the level that is generally considered “affordable”) has trebled since the late 1980s. The impact has been the most stark for those on low incomes, living alone and in private rentals (Perry, 2019).
New Zealand today
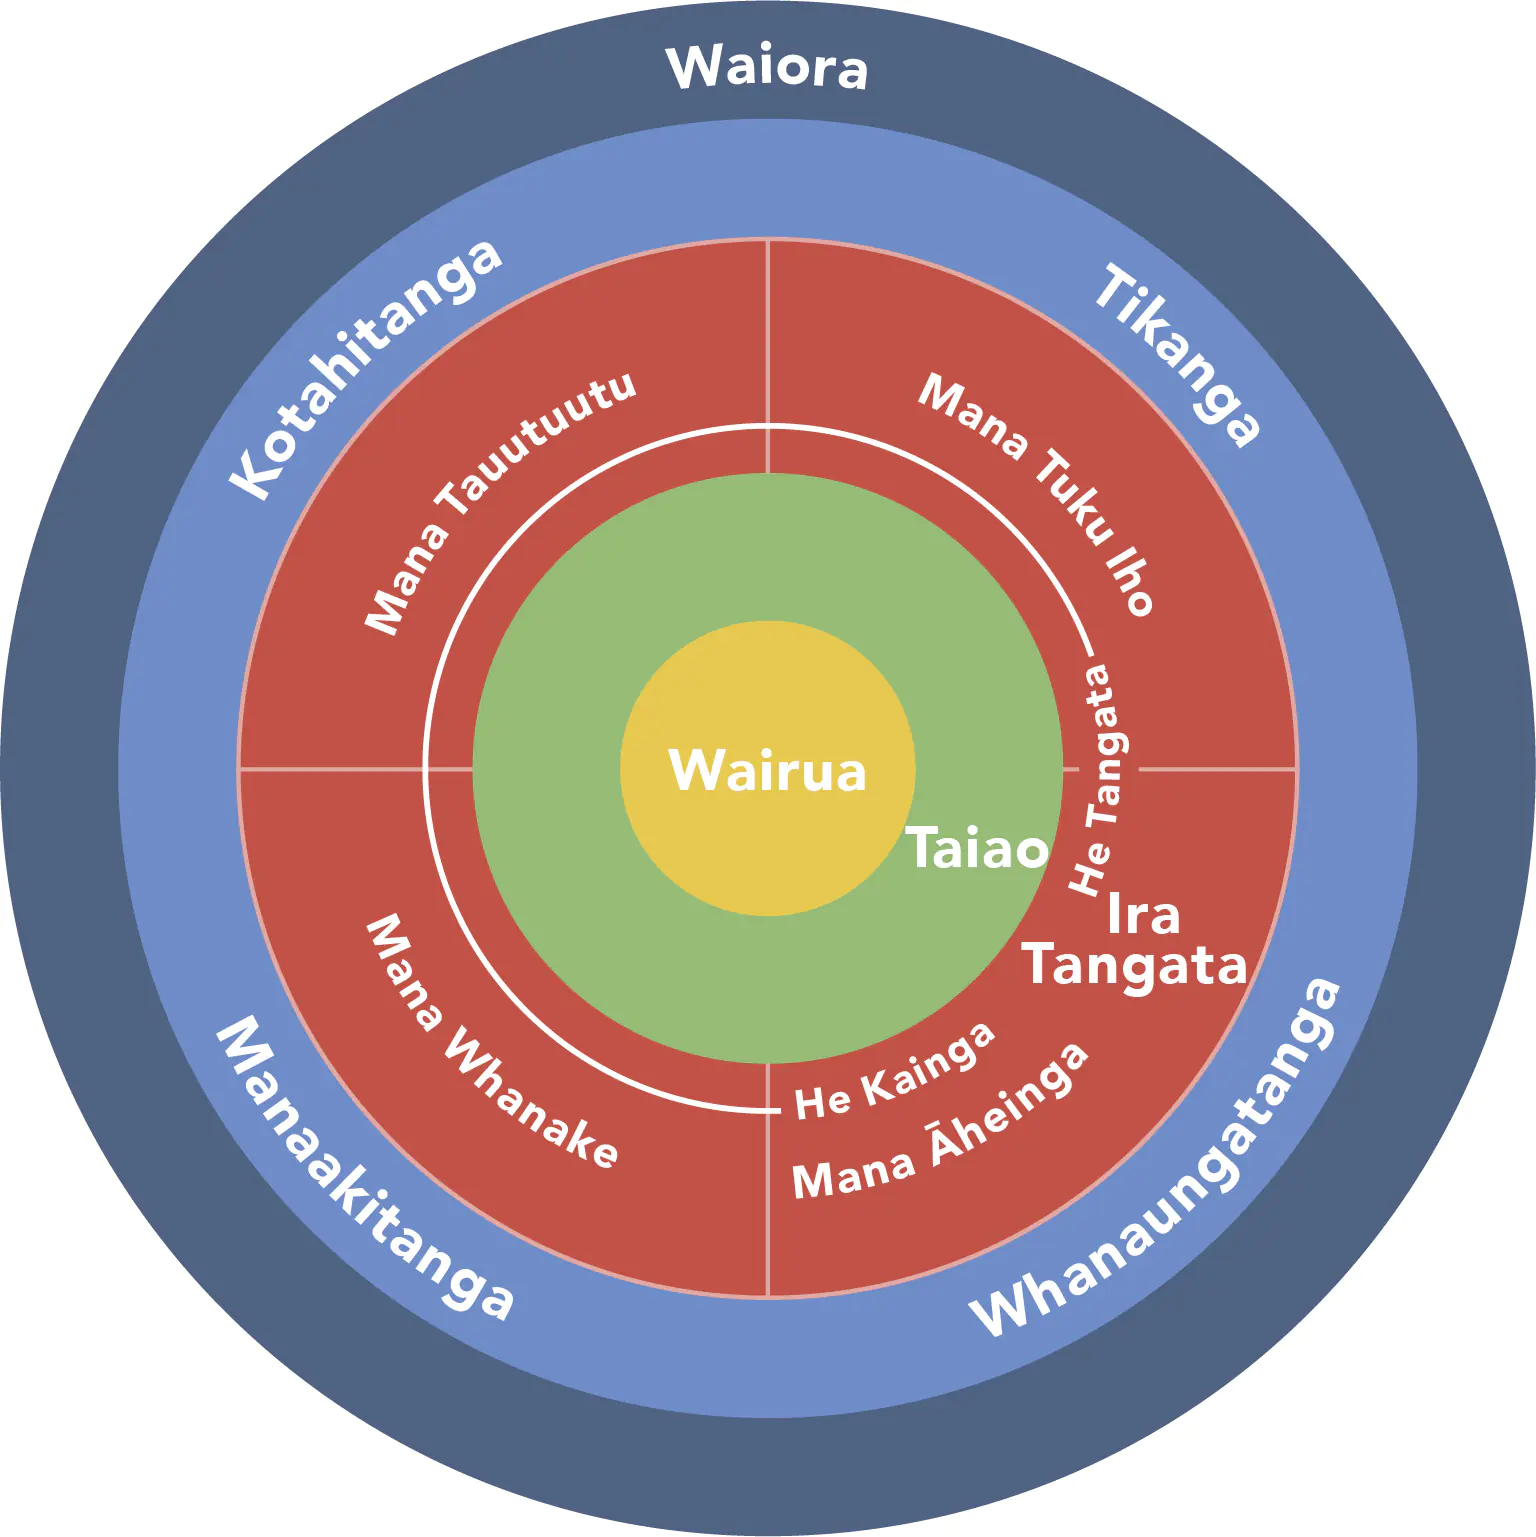
As noted above there are no official measures for He Ara Wairoa as yet. Work is underway to identify the best existing sources of data and what new indicators and measures may be required. It is worth noting this framework is strengths-based, while most data we have is on the absence of those strengths (ie, deficits). This section pieces together some of what we know based on existing data.
Mana tuku iho (identity and belonging)
More than one in 14 people suffer psychological distress in a given four-week period. This figure is much higher for Māori, at one in seven. Rates of loneliness are higher for sole parents, people not in the labour force for health reasons and recent migrants (New Zealand Government, 2021).
Perhaps the most extreme measure of a lack of identity and belonging is suicide. In New Zealand suicide rates are below the OECD average for most groups (OECD Better Life Initiative, 2020a).
But one group that stands out is young people. New Zealand’s youth suicide rate is the second worst in the OECD at 14.9 deaths per 100 000 adolescents (UNICEF Innocenti, 2020). Māori youth are particularly at risk.
Mana tautuutu (rights, obligations and participation in strong communities)
Over 5% of people report they have no friends or relatives they can count on in times of trouble. This is lower than the OECD average (8.6%) (OECD Better Life Initiative, 2020b). Māori, Pasifika, females, sole parents and the unemployed all report they are more likely to suffer discrimination (New Zealand Government, 2021).
New Zealand has the highest rates of volunteering in the OECD, with almost a third of the working age population volunteering at least once a month. The country is also regularly among the countries with the lowest rates of perceived corruption. Trust in the police and government is relatively high, with New Zealand ranking in the top quarter of OECD countries (OECD Better Life Initiative, 2020a).
Mana āheinga (opportunity and capability)
Material wellbeing statistics track whether people have access to the basics needed to participate in society, such as adequate food and clothing, warm housing and the ability to pay unexpected bills. Based on the latest statistics around 7.5% of people live in households facing material hardship (Stats NZ, 2021a).
Around 11% of households with children aged 0-17 face material hardship (Stats NZ, 2021b). This is close to the EU average, but significantly higher than Nordic countries (4-6%) (Perry, 2019).
Rates are higher for Māori (20%), Pasifika (26%), and children living in a household with a disability present (20%). Historically, rates have also been high in households with a sole parent or jobless parents.
Rates of material hardship are higher for households with younger people because they are less likely to own their own home. As noted, housing is a major driver of rising disadvantage in New Zealand. This is particularly the case among younger age groups. Average housing costs are 25.9% of income, the highest in the OECD. This is despite housing in New Zealand often being of poor quality (OECD Better Life Initiative, 2020b).
New Zealand’s rates relatively well on education and health, but these averages gloss over some large pockets of disadvantage. New Zealand has some of the largest variations in achievement in reading and science associated with disadvantage compared with other countries (May et al., 2019). The Ministry of Education’s work on the Equity Index shows that some socio-economic indicators are strongly correlated with education performance. On average Māori live more than seven years less than non-Māori. UNICEF (2020) ranked New Zealand 35th out of 41 rich countries for child wellbeing. The rankings were particularly low for mental health and physical health, due to high rates of suicide and obesity.
In all, opportunity is the domain where New Zealand rates most poorly compared with other nations. High housing costs increase the pressure on households, especially those with lower incomes. Some children growing up in persistent disadvantage are not getting the health and education they need to thrive. This may limit their lifetime potential, contributing to their persistent disadvantage. The system is failing the most disadvantaged families and communities.
Mana whanake (income, wealth and sustainable growth)
New Zealand’s poverty and inequality rates are around the middle of international rankings, slightly above the average for OECD countries. Incomes are below average, despite working hours being above average. The main issue here is New Zealand’s poor productivity record, which may be in part due to people not being able to reach their potential.
New Zealand’s tax and welfare system is less redistributive than many other OECD countries (though this assessment doesn’t include the impact of in-kind transfers such as health and education). New Zealand has higher rates of poverty among households without work, although this may change with recent benefit increases.
Wairua (holistic wellbeing vs persistent disadvantage)
As noted earlier, wairua is at the centre of this model of wellbeing. This means that achieving holistic wellbeing requires strength or resilience in each of the other aspects of the model. The antithesis of this is the persistent disadvantage that we aim to investigate through the inquiry.
On average, New Zealanders rate their satisfaction with their own lives 8 out of 10 (Stats NZ, 2021c). This is a measure of “self-reported subjective wellbeing” and is higher than the OECD average (OECD Better Life Initiative, 2020b). The groups that rate their lives the lowest are sole parents, the unemployed, and those not in the labour force due to injury, sickness or disability. For working-age people, life satisfaction appears to be closely tied to employment, probably because it offers income and a sense of purpose (which is linked to mana tuku iho – identity). However, a sense of purpose doesn’t necessarily need to be tied to paid employment. Overall, employment is relatively high (and unemployment low) in New Zealand. But just over 13% of young people (aged 15-24) are not in education, employment or training.
There isn’t much information about who faces persistent disadvantage across one or more mana. As an indicator, according to the latest statistics (2019-20) up to 28% of children are in households facing income poverty (after housing costs) and 11% face material hardship. About 7% (around 75 000) children are in households facing both income poverty and material hardship (Stats NZ, 2021b). These data illustrate there are many different groups facing different types of disadvantage, as well as groups facing multiple disadvantages.
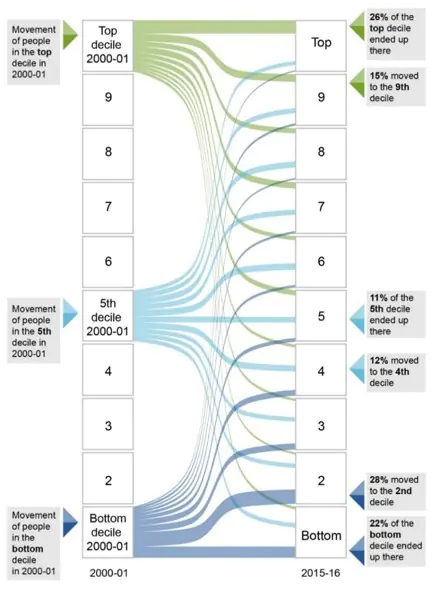
These statistics are based on static (ie, point-in-time) measures of poverty. Due to the lack of data that surveys the same people and households over time, little is known about how much disadvantage persists in New Zealand. We know that some of those experiencing low incomes at any one time will move out of that situation over time (eg, students that go on to have high earnings after study). As would be expected, local and overseas evidence has shown that estimates of poverty and inequality are lower when it is based on longer time frames.
Previous New Zealand studies illustrate this point, although their data are now over a decade old. About one in four respondents lived in households with low incomes (less than 60% of the median), while 13% faced material hardship (9% were in both groups). When tracking people over time (ie, longitudinally from 2002-09), those numbers were 15-20% lower, with 21% being on “chronic” low incomes, and 11% in chronic material hardship (about 7% were in both groups). Disadvantage rates were higher for Māori and households with children (Carter & Gunasekara, 2012).