Annual report FY 2022/23
Table of contents
- Annual report timeline
- Our year in numbers
- Chair’s message
- Strategic context for our work
- What we’re here for
- Who we are
- How we measure success
- Our work this year
- Our performance this year
- 2022/23 Financial summary
- Statement of responsibility for the year ended 30 June 2023
- Independent Auditor’s Report
- 2022/23 Financial statements
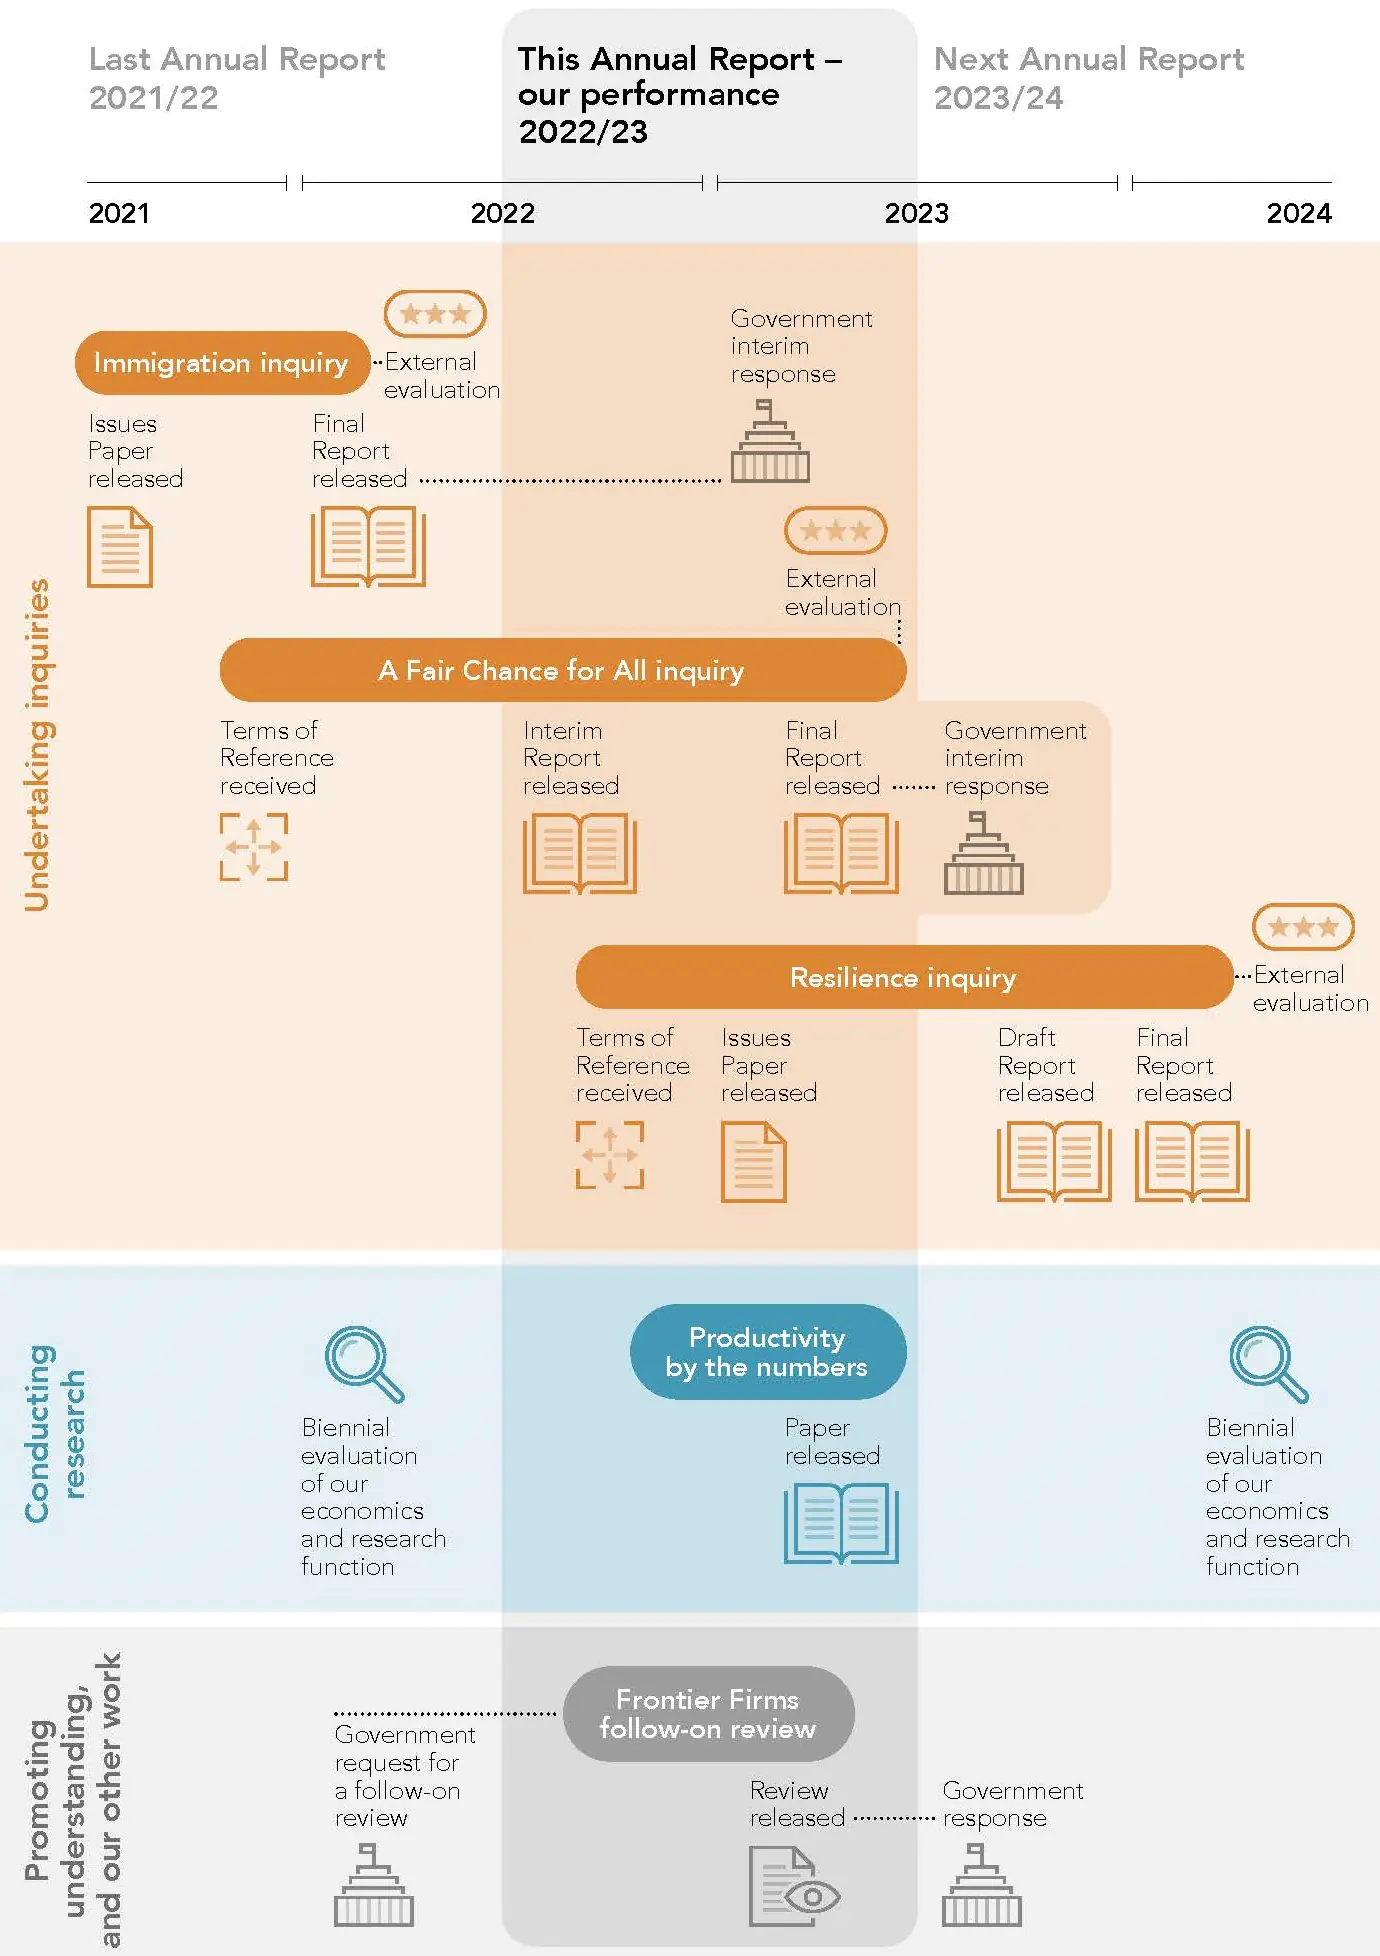
Annual report timeline
Annual report timeline
Our year in numbers
Our year in numbers

Chair’s message
Ka tangi te titi
Ka tangi te kaka
Ka tangi hoki ahau
Tihei mauri ora
Tēnā koe
I’m pleased to present the Commission’s Annual Report for the 2022–2023 year – another busy and productive one for Commissioners and staff.
For me, this year has been marked by an acknowledgement of the intrinsic link between people, place, and productivity, reinforcing the importance of taking a long-term approach to investment in innovation, technology, infrastructure, people, and our environment to lift productivity and improve wellbeing.
We continue to lift our sights to encapsulate a broader view of productivity and the importance of focusing on the long-term to lift productivity to improve wellbeing. Critical in this task is the foundation of all productive and economic activity – the nature and quality of resources.
We have applied this lens and the need to take a long-term perspective in our work this year, and this has been a strong theme throughout the reports we have published. The findings and recommendations made in the final reports for our A Fair Chance for All inquiry, and Frontier Firms Follow-on Review, and the narrative in our Productivity by the numbers 2023 report send a strong message that productivity matters for wellbeing. But productivity requires a long-term commitment – innovation and technological change with appropriate investment efforts to drive growth.
Taking a long-term view of productivity, aligned with substantial and sustained investment effort in the resources we hold under our watch – bricks and mortar infrastructure, our people, communities, knowledge, creativity, and learning – fits well with a kaitiaki, or guardianship perspective on our nation’s resources or assets.
We use this kaitiaki perspective to guide us in our work to advocate for more meaningful and long-term investment to lift the country’s productivity record.
Recognising our obligations under Te Tiriti o Waitangi, we have continued our journey to uphold the mana of te Tiriti. We are building an organisational culture that embeds a te ao Māori worldview in our engagement and ways of working. Embracing te ao Māori perspectives in our mahi is vital to ensuring our advice reflects the views and interests of all New Zealanders.
I extend my heartfelt thanks to my fellow Commissioners and staff for their contribution to all that we have achieved during the past year. I also express my gratitude to the many communities, organisations, agencies, and businesses that have engaged with us. Your valuable input and feedback have enriched our research and reports, helping to generate debate and discussion. I am proud of the very high quality of the research and reports we have published this year, which I hope will influence policy change and decision making.
Armed with a deep understanding of the interplay between productivity, people, and place, we remain steadfast in our commitment to advocate for the importance of taking a long-term perspective to productivity and wellbeing. Our work on development of our organisational strategy that sets the direction for our future work programme positions us well to face the challenges and take advantage of the opportunities that lie ahead.
I look forward to 2024 to deliver a work programme towards achievement of our strategic objectives, enabling us to realise our vision to lift productivity and improve the wellbeing of current and future generations of New Zealanders.
Ngā mihi nui,
Dr Ganesh Nana
Chair
New Zealand Productivity Commission Te Kōmihana Whai Hua o Aotearoa October 2023
Strategic context for our work
Aotearoa New Zealand’s productivity performance overall remains low. The nation has increased its production of goods and services mainly by using more productive factors (working more hours and putting more people into work) and/or engaging in more harmful or depleting activities.
The relationship between productivity and wellbeing
For the Commission, as required by our Act, we need to consider the link between productivity and wellbeing. Productivity and wellbeing are interrelated, but in a complex and mutually beneficial way. For example, improved wellbeing has multiple influences, with productivity being just one of them. Wellbeing itself can also lead to higher productivity, as summarised in our publication, Productivity by the numbers.
Productivity gains that support rising material living standards are necessary pre-requisites for wellbeing improvements. We use Treasury’s Living Standards Framework and He Ara Waiora to consider wellbeing. These frameworks explore wellbeing from different cultural perspectives, values, and knowledge systems.
Our work centres on a core insight that productivity growth is about working smarter not harder. And then promoting understanding that such productivity growth is a pre-requisite for sustainable increases in incomes and material living standards.
Understanding the relationship between productivity and wellbeing allows us to approach our work in a way that makes productivity meaningful and not merely an end in itself. This enables us to focus on what’s beneficial for the people of Aotearoa New Zealand.
How can productivity be lifted?
Improving productivity requires a long-term commitment, with innovation and investment key factors to achieving this. The choices we make today will influence the productivity and standard of living tomorrow and for future generations.
There is no simple formula for lifting productivity.
The road to improvement sits with a wide range of actors. Successful economies are based on individuals, whānau, communities, businesses, iwi, and education and research institutions all doing the best with what they have, within the context set by the Government.
While choices made by the private sector determine the economy’s overall productivity performance, Government can encourage choices that raise productivity and wellbeing. Effective investment in people, physical capital, the natural environment, institutions and regulations, and innovation are all relevant to achieving a sustained shift in the productivity dial for Aotearoa New Zealand.
Innovation and technological change are critical to productivity growth. The Government can do that by building dynamic innovation ecosystems in specific areas of the economy, with firms at the centre of these ecosystems. But these ecosystems also include engaged workers with the right skills, international links, researchers, education and training providers, mentors and investors with deep knowledge and understanding of the industry and communities. Sustained long-term investments in these areas are central to lifting the productivity of the resources available to the nation.
The Māori economy exhibits many of the characteristics for long term investments that are needed for firms to innovate, grow, and support higher living standards.
Much of what the Commission explores is at the intersection of public and private sector interactions – the nature of the incentives faced by entrepreneurs as they make their choices and how those incentives can be designed to facilitate and encourage high productivity outcomes.
Among our previous inquiries, and as summarised in Productivity by the numbers, we have established findings and made a range of recommendations to help improve understanding of productivity and to inform and empower Government and change makers to support productivity growth.
What we’re here for
We carry out high-quality, innovative research, evidence-based inquiries and promote understanding of productivity-related topics. In producing and publishing research and reports, the Commission aspires to inform decision making and influence behaviours of Government, industry, and communities. To do this effectively, the Commission must be rigorous, trusted and a skilled communicator.
Our vision
Our vision is to strengthen productivity in Aotearoa New Zealand and its connection to improvements in the wellbeing of current and future generations of New Zealanders.
Our purpose
As embodied in the New Zealand Productivity Commission Act 2010, the principal purpose of the Commission is “to provide advice to the Government on improving productivity in a way that is directed to supporting the overall wellbeing of New Zealanders, having regard to a wide range of communities of interest and population groups in New Zealand society.”
It is not enough for the Commission to simply produce reports. The analysis and commentary in our reports should be disseminated, understood and influence policy and other behaviours so that, in the long term, we contribute to improving productivity.
The importance of our independence
We operate independently in delivering our work. Independence means that we make our own judgements based on extensive research, evidence-based analysis, and widespread engagement with stakeholders.
The following factors are critical to our independence:
- Statutory independence: We are statutorily independent by virtue of our Act and the Crown Entities Act. This is critical to our effectiveness.
- Operational independence: In practical terms, this means we have the requisite capability to carry out our inquiry and research work and publish our findings, as well as engage and collaborate with a wide range of parties.
- Impartiality and objectivity: It is fundamentally important for us to act impartially and objectively as we undertake our work. Independent, published evaluation of our work is also a critical dimension of our performance framework.
Who we are
The Commission has four Commissioners: Dr Ganesh Nana (Chair), Dr Bill Rosenberg, Dr Diane Ruwhiu and Vicky Robertson, who was appointed in July 2023. As the Board, they are accountable to Parliament and report to the Minister of Finance, as the responsible Minister. The Chair and Commissioners are responsible for the effective governance of the Commission. This includes the appointment and performance of the leadership team, setting and monitoring the strategic direction, delivery of and compliance with accountability documents, risk management, integrity of processes and the overall health, wellbeing, and sustainability of the organisation. Commissioners also oversee the delivery of our work programme and shaping the scope, content, balance, quality, and presentation of our research and reports.
Our people
 |
Our team comprise 23 permanent staff |
 |
with approximately 50-50 gender split |
The quality of our people is critical to our success. The nature of our work necessitates that we have access to specialists in a variety of disciplines including economists, statisticians, econometricians, policy analysts, and experts in engagement and communication, as well as a wide variety of specific subject matter expertise.
Our people bring diverse skills, disciplines, and backgrounds to benefit our organisation, on a mixture of permanent and shorter, fixed-term contracts. We supplement our permanent team with consultants to bring specialist knowledge, experience, and fresh perspectives, as required, and through secondments to take advantage of expertise across the public sector.
We are committed to upholding the mana of Te Tiriti o Waitangi, placing our obligations to te Tiriti at the forefront of our work, and in the way we work. We use the Māori engagement principles established specifically for Tiriti-based partnerships to guide us in our consultation and engagement with stakeholders, ensuring our work makes a difference to lift productivity and improve the wellbeing of current and future generations of all New Zealanders.
Our governance and management
Board:
- Dr Ganesh Nana, Chair
- Dr Bill Rosenberg, Commissioner
- Dr Diane Ruwhiu, Commissioner
- Vicky Robertson, Commissioner
Leadership team:
- Dr Philip Stevens, Director, Economics & Research
- Shelley Catlin, Director, Operations
- Catherine Proffitt, Inquiry Director
- Julian Wood, Inquiry Director
How we measure success
Due to the complex nature of productivity issues, the influence of our work will generally only emerge over long timeframes. Identifying changes in productivity performance or wellbeing that can be directly attributed to our work, as distinct from the many other factors that influence productivity performance can be challenging.
The nature of our role means that the inquiry topics we undertake, and the approaches we use, which are defined in part by referring Ministers through Terms of Reference, can vary. This makes the comparison of some performance measures, between years, challenging. Our service performance is outlined in the “Our performance this year” section (pages 11 to 14 and 26 to 36) and our end of year reporting requirements as per the Estimates of Appropriations 2022/23 (Finance and Government Administration Sector) are outlined on page 39.
Disclosure of Service Performance Reporting judgements
In determining key service performance information for our intended impacts and outputs, the Board has used judgement based on our purpose as embodied in the New Zealand Productivity Commission Act 2010, our vision, and their intended contribution to achieving the outcomes we seek. The performance measures selected are at the discretion of our Board.
The “Our performance this year” section reports against the performance measures contained in the Statement of Performance Expectations 2022/23. Service performance information in this section is presented in accordance with PBE FRS-48.
Performance measures for our impacts and outputs have been selected for our key activities and range from short-term to long-term (see Figure 1) and are described in more detail below.
In selecting measures, we have made judgements to determine which aspects of performance are relevant and material to readers. These measures also inform our internal management and decision making.
Our measurement methodology
The material judgements we apply to assessing and reporting on our impacts and outputs are specific to the assessment method:
Monitoring of media
- References made to the findings and recommendations made in our reports and our research, and mentions in Hansard, are an indicator of the role of our work in generating discussion and debate. Mentions by third parties also indicate the level of public and political discussion and debate on our work.
- We use the media monitoring service provided by Fuseworks to monitor third party commentary (online and print including Hansard) on our work and the Commission in general.
- Fuseworks provides all mentions of the Productivity Commission based upon key words we identify. We manually check the Fuseworks report weekly to ensure mentions relate to the Commission and our work. We then assess and tag each mention as they relate to our outcome, impact and output measures. Our communications team use their judgement to assess the commentary made on our work for the nature of the sentiment.
- We will use judgement to report information that gives an accurate and insightful representation of commentary or mentions, including their nature and source.
Monitoring and review of formal Government responses
- Following the delivery of our inquiry final report to referring Ministers, we expect to receive a formal response from Government that indicates the degree of agreement with our recommendations. The response will also include indications of commitment to exploring or implementing our recommendations, which may lead to policy change.
Monitoring of milestones
- The monitoring of milestones for our outputs demonstrates our ability to effectively manage our processes, meet deadlines and meet the expectations of our stakeholders.
- For inquiries our key milestones are outlined by referring Ministers in the Terms of Reference, as to the delivery of a draft and final report. Intermediate milestones are then developed based on the scope described in the Terms of Reference, our knowledge of past inquiry delivery, available capacity and likely capacity of key stakeholders. These are approved by the Commission’s Board.
- We publish milestones for our key outputs on our website and display our progress in achieving them during the inquiry process and following completion.
Survey
- Evaluation using a survey provides us with both quantitative (through Likert scale responses) and qualitative (through open text questions) measures of our effectiveness for our impact and output measures. The survey also allows us to gather a large amount of data from stakeholders most involved in the inquiry, and therefore in the best position to provide feedback on performance and impact.
- Answer options used for the Annual Report take the form of Likert scales, often with six options, two positive, one neutral, two negative, and a “Don’t know” option. Exceptions to this are the initial qualifying questions gauging the organisation type of the respondent and their involvement in the inquiry. We also include an initial question on whether the inquiry has increased the respondent’s understanding of the topic, which is required for our impact measure on policy change – increasing understanding.
- We run the survey through our Survey Monkey premium account, which enables us to design, operate, monitor and analyse the survey results.
- Our measures specify which aggregated responses to report from each survey question. No judgement is applied to the interpretation of this data.
- To evaluate our A Fair Chance for All inquiry we wrote a survey featuring questions based upon:
- the measures and answer options as stated in our Statement of Performance Expectations 2022/23, and
- the survey questions asked in the previous inquiry evaluation (Immigration) to ensure effective comparison.
- We invited all inquiry participants from our database to complete a survey, which included participants who had made a submission or were actively involved in the inquiry. We had a response rate of 12% (146 responses from 1231 invitations). We have included a comparison of results from our survey of the 2022 Immigration inquiry, which had a response rate of 35% (100 responses from 289 invitations). The A Fair Chance for All inquiry survey had a lower response rate when compared with the Immigration inquiry as the nature of the inquiry meant it had a broader range of interested parties and the survey was sent to a far broader range of stakeholders.
Expert review
- The expert review provides the Commission and its stakeholders with an independent view on where the inquiry performed well, and where there is room for improvement in future inquiries.
- The primary evaluation frame for the expert review comes from the Commission’s six output measures. We exercise judgement in selecting summary comments that best address the measures and provide insight to the reader.
- The A Fair Chance for All evaluation is the first time the Commission has brought together the traditional evaluation components (expert evaluation, focus groups, survey) into one combined report. Previous inquiry evaluations have delivered the review, focus groups and online survey components separately. The intent of commissioning the evaluation in this way was to enable greater triangulation and synthesis of the findings across the various data sources, with the view to eliciting richer commentary and more robust and usable recommendations for future quality improvement.
Focus group
- Focus groups allow us to gather qualitative data from key stakeholders and delve into the reasoning for their views on our work. The focus groups are run by independent consultants as part of the inquiry evaluation, to ensure results are captured without bias.
- We exercise judgement in selecting summary comments from the focus groups that best address the measure and provide insight to the reader.
- For the A Fair Chance for All inquiry, our evaluation consisted of nine interviews and two focus groups with a total of 17 participants across both groups. Focus groups were designed to capture different types of conversations. The first group focused on academics/subject experts and community sector representatives. The second group focused on public sector professionals.
- The results from this survey are compared to the focus groups of the 2022 Immigration inquiry, which collected feedback from 12 people representing industry groups and other stakeholders who were actively involved in the inquiry process. The focus group process included individual interviews, and two small group sessions.
To ensure a robust approach to assessing and reporting on our performance, we use qualitative and quantitative methods mentioned above, and often a mix of both.
For the reporting year 2022/23, there were no constraints collecting performance information.
The Commission sets targets for performance measures based on a combination of historical performance, with consideration of factors that may impact future performance and opportunities for improvement. As such, future performance may differ from budgeted performance.
We review our performance measures each year. Any proposed changes are approved by our Board; and outlined in our Statement of Performance Expectations for the following reporting period.
Our impact indicators
To support our aspiration to influence the behaviour of government, industry, and communities through our work, we look for evidence of our impact against three indicators.
Policies and behaviours change as a result of the Commission’s work. Evidence of a greater understanding of our work will lead to a better uptake and implementation of our recommendations. This will contribute to better decision making on the policies and programmes that could lead to improved productivity and wellbeing.
Generating discussion and debate. Wide-ranging discussion and debate by diverse voices is more likely to influence decision makers. Our reporting looks at evidence of our work being used by influencers, particularly those providing commentary on, or input into, policy and how and where our work is cited in those discussions.
Levels of engagement with, and responses to, our work. We look for feedback and mentions of our organisation that indicate our work plays a role in increasing the quality of analysis and advice on productivity-related topics and issues.
Our output measures
The key elements of our approach to performance measurement include six output measures.
Right focus – the relevance and materiality of our inquiry and research reports.
Good process management – the timeliness and effectiveness of our processes.
Effective engagement – quality of our engagement with interested parties.
Clear delivery of message – how well our work is communicated and presented.
High-quality work – the quality of our analysis and recommendations.
Overall quality – the overall quality of the work considering all factors.
Figure 1 How we measure the impact of our work

Our work this year
- 1 completed inquiry
- 1 follow-on review
- 1 new inquiry
Undertaking inquiries
The Government asks the Commission to undertake inquiries into current issues to provide independent policy advice that can lead to improved productivity.
In this reporting period we received the Government’s interim response to our Immigration: Fit for the future inquiry report, which was completed in the previous financial year. We completed our inquiry into economic and social inclusion with the publication of our final report A Fair Chance for All: Breaking the cycle of persistent disadvantage, and we started work on a new inquiry into improving Aotearoa New Zealand’s economic resilience to persistent supply chain disruptions.
Although not a full inquiry, we also completed work on the Government’s request for a follow-on review to the New Zealand Firms: Reaching for the frontier inquiry.
Immigration: Fit for the future
We received an interim response from Government to our Immigration: Fit for the future report on 3 April 2023. The response highlights general agreement with the 24 recommendations made in our final report.
In its interim response, the Government discussed a range of changes for future work needed based on our recommendations, including the role of Te Tiriti o Waitangi in immigration and the development of a government policy statement on immigration.
The Government said that our report illustrated the importance of the correct immigration settings and the need to improve the public’s understanding of our goals.
The response summarises the major reforms being undertaken to drive a more coordinated, connected, and longer-term approach to workforce planning and development, as well as the further work that’s needed based on our recommendations.
- 32 findings
- 24 recommendations
A Fair Chance for All: Breaking the cycle of persistent disadvantage
The Government asked the Commission to conduct an inquiry into economic inclusion and social mobility – a fair chance for all – focusing on the drivers and underlying dynamics of persistent disadvantage (within people’s lifetimes and across generations). We were asked to develop recommendations for actions and system changes to break or mitigate the cycle of persistent disadvantage.
We adopted a new approach for this inquiry, engaging with agencies, organisations, and the public prior to having the terms of reference agreed. We continued to engage extensively with stakeholders throughout the inquiry process – many of which were organisations and groups that we had not engaged with previously.
We undertook novel quantitative analysis in-house to look at how disadvantage persists through time, using Census and Stats NZ survey data.
We also commissioned speciality research to contribute to our final report, including:
- public accountability settings (NZIER) and system learning and improvement (FrankAdvice)
- system mapping to deepen our understanding of the systemic barriers and drivers of persistent disadvantage and interconnections with the public management system (Deliberate)
- changes in family incomes from 2007 to 2020 and family resources across the early life course and children’s development (Victoria University).
This supplemented research that we commissioned for earlier stages of the inquiry, which included:
- a synthesis report of lived experience of disadvantage
- a review of joined-up social services to assess their effectiveness and identify barriers and enablers
- a report to develop our understanding of persistent disadvantage for Māori and Pacific people by exploring the relationship between colonisation, racism and wellbeing from Haemata
- an analysis of data from the Growing Up in New Zealand study hosted by University of Auckland, which looked at the relationship between household resources and wellbeing outcomes for children.
Our final report, released on 31 May 2023, contained 20 findings and 20 recommendations, including some for substantial change at the public management system-level. We published a companion report, A quantitative analysis of disadvantage and how it persists in Aotearoa New Zealand, containing a detailed definition for how we measured disadvantage, and our in-depth empirical findings.
In its interim response on 7 September 2023 to our recommendations in this inquiry, the Government signalled its support of a strong focus on addressing disadvantage.
The Government expressed interest in pursuing particular recommendations, including introducing new legislation (a Wellbeing of Future Generations Act), establishing a Commissioner for Future Generations, the establishment of a social floor that measures levels of both material and non-material wellbeing necessary for social inclusion and the Commission undertaking a follow-up inquiry in three years’ time.
We are expecting to report on the full response in the next annual report.
A post-inquiry evaluation including a survey of participants in the inquiry was completed. The results from these have been used in the performance measures for the inquiry in this report. A full copy of the results of the post-inquiry evaluation will be published on our website.
- 149 engagement meetings
- 154 submissions received
- 20 findings
- 20 recommendations
Frontier Firms Follow-on review
The Government asked the Commission to undertake a follow-on review of progress on the Government’s policy settings, workstreams and initiatives following our 2020–2021 inquiry on New Zealand Firms: Reaching for the frontier.
This was the first time the Government has requested a follow-on review of a completed inquiry.
As part of our review to assess the progress on the recommendations made in the 2021 report we met with stakeholders and undertook a “helicopter-level assessment” of whether the Government’s reform agenda is having the intended effects.
The final report recommended that focused innovation policy was vital to lifting national productivity and wellbeing. To help lift the wellbeing of New Zealanders, frontier firms in Aotearoa New Zealand need to raise their performance closer to the global frontier, and they need to grow larger and diffuse innovation through the rest of the economy. Policy needs to support the development of focused innovation ecosystems in which these frontier firms will grow and thrive.
We recommended a package of six actions to improve the chances of success.
Along with our final report we also published a supplementary report with detailed observations on what progress we found had been made on the recommendations in the original report for the Frontier Firms inquiry.
As this review fell outside of our usual inquiry criteria, we didn’t undertake a formal post-inquiry evaluation. Performance measures for the follow-on review are not included in this report but have been covered as part of the overall reporting against our impact indicators.
The Government’s response to the Commission’s report Follow-on Review – Frontier Firms on 28 August 2023, noted that the “follow-on report provides useful insights into New Zealand’s progress towards a more sustainable, inclusive and productive economy.”
The Government agreed with our finding that the National Research Priorities process should “not be a top-down exercise led by government, but rather a broad and collaborative process where we partner with industry, researchers, workers, Māori, and education and training providers to understand emerging innovation possibilities.”
We will continue to take this advice into account in future work. We appreciate the Commission’s considered response and the evidence it brings to support its recommendations. Hon Grant Robertson, Minister of Finance
- 60 stakeholder meetings to assess progress on our 2021 recommendations
- 20 findings
- 6 recommendations
Improving Economic Resilience – ongoing inquiry
The Commission began work on an inquiry to identify policies and interventions that can enhance the resilience of Aotearoa New Zealand’s economy and living standards to persistent supply chain disruptions.
An issues paper was published in February 2023 for public consultation. We worked closely with economists Brian Easton and David Skilling in the development of the issues paper. The findings of their research were published in parallel with the issues paper, and both can be found on our website.
We engaged extensively with stakeholders as part of our consultation to inform our findings and recommendations for the final report.
We undertook research into Aotearoa New Zealand’s trade vulnerabilities building on work undertaken by the Australian Productivity Commission. We also commissioned Motu economic and public policy research to undertake two research projects to examine:
- the impact of a series of representative shocks on the economy using computable general equilibrium (CGE) modelling
- involuntary layoffs and the impact of the local labour market on employment and earnings of those who were involuntarily laid off.
Alongside these we commissioned Haemata to undertake a series of wānanga and engagement meetings to gain an insight on Māori and iwi views to guide the findings and recommendations for our final report.
The report from Haemata detailing the results of three wānanga involving 50 participants from a range of stakeholder groups has been integral to ensuring we bring a te ao Māori perspective on resilience, considering He Ara Waiora dimensions and how it applies not only within Māori businesses and communities but also for wider Aotearoa New Zealand. Our final report for this inquiry is due to be delivered to Government in February 2024.
The performance measures for this inquiry will be reported in the next reporting period, following completion of the final report.
- 80 engagement meetings with 50 organisations
- 59 submissions on the issues paper so far
Conducting research
- Published 2 working papers on productivity related issues
- Completed 3 research papers to support our inquiry work
- Supported the research sector with 14 presentations
- Ran 7 seminars bringing 236 participants together to discuss productivity related issues and research.
Our Economics and Research (E&R) team form a critical part of our capability and support all three functions of the Commission. We have a programme of primary research to build our understanding of Aotearoa New Zealand’s productivity performance and the role of policy in lifting productivity. We also create data infrastructure to underpin research on firm productivity and labour market performance carried out by other government departments, and academic and independent research institutions.
Productivity by the numbers
This year we published the latest edition of Productivity by the numbers, 2023. This publication is a key resource aimed to inform and generate discussion about lifting Aotearoa New Zealand’s productivity. It provides an assessment of the performance of the New Zealand economy and a framework to help people understand productivity.
We developed a range of supporting resources to make this publication more accessible and enhance the impact and contribution of it in our work to educate and promote understanding of productivity- related matters to the wider community.
We produced a visualisation tool and data file that all the graphs and quantitative material are based on, enabling other organisations to use the material from the report to support their own research and publications.
An evaluation of this publication will be undertaken in 2024, as part of the biennial evaluation of our economics and research function.
Promoting understanding
We completed:
- 57 presentations
- 17 events and webinars
- 25 interviews with the media
Our work continues to attract high levels of media interest with coverage across a range of media outlets, and in newsletters and media releases from other organisations. We have observed a good balance of articles published as a direct result of proactive work by our communications team. This has included interviews following publication of media releases, as well as the republishing, sharing and inclusion of our content in channels of other organisations.
The diverse range of channels used to communicate our research and reports is critical in our work to promote wider understanding of productivity and wellbeing. These channels include a mix of in-person and online events and webinars, which were recorded and made available for viewing on our website.
Presentations by our Chair, leadership team and staff to the wider community at industry events, conferences and participation in panel discussions, hui and webinars across the motu have also provided a valuable platform for us to promote understanding of productivity-related issues and our inquiry work and research.
During this reporting period there were 528 mentions of the Commission or one of our inquiries in a range of publications (see Figure 2). Of these, 439 generated discussion and debate around productivity-related issues in the media. There were 36 mentions in the media of the Commission’s role and our general work in productivity related matters during this reporting period.
Media
- Sent out 12 media releases
- Published 7 opinion-editorials
- 439 mentions of the Commission in the media.
Our efforts to be more innovative in the presentation of our work to reach a broader range of people is reflected in the high levels of media interest and good coverage across the broad range of media outlets.
Frequent mentions of the Commission’s work and recommendations made in our past inquiry reports by a range of decision makers and organisations in discussion and debate around productivity confirms the importance of our work.
Figure 2 Mentions in media by inquiry reports

Website
- 130,913 page views of our website by 38,270 people
- 61.9% of these were new visitors
- 9,489 downloads of our reports
- 3,360 accessible page views.
Our website is the primary channel used for promoting our work. It provides a one-stop shop used to publish our research and reports and promote understanding of productivity-related issues.
During this period, we completed work with SOMAR Digital to improve accessibility on our website and increase visibility of new content. This included changes to the way our research information is presented on the website, as well as our publications, and some changes made to the main menu bar to promote key areas of our work.
Accessible versions of our reports and links to recordings of our events on our website provided increased visibility and accessibility of our work. We have seen a high proportion of views of our reports via this format since this feature was introduced, making our work available to more people.
Following the introduction of the New Zealand Plain Language Act 2021, our website content was reviewed and updated. We have also undertaken training with staff, and updated our style guides to ensure all our published material and communications activity complies with the requirements of the Act.
Social media
Our online presence is growing with:
- 3,060 LinkedIn followers
- 214 YouTube subscribers
The use of other online channels to promote our work has gained momentum this year. We deactivated our Twitter account during this period and focused on LinkedIn and YouTube as more effective channels to promote our work. We have gathered a high number of followers on these platforms, and we are pleased with the impact that these have had on enabling us to share our presentations, promote understanding of productivity-related matters and broaden our audiences.
Newsletters
- We achieved an average open rate of 46% for the 18 newsletters
- As at 30 June 2023 we had 4,301 subscribers.
We engaged with key stakeholders through both regular and ad hoc newsletters. With a subscriber base of over 4,300, our external stakeholder newsletter plays a key role in helping us to further extend our reach to the wider community. Our newsletter provides an opportunity to directly link readers to our website for more detailed information.
The effectiveness of this channel in our work to promote understanding is evident in an average open rate of 46% for the 18 newsletters sent out during this year. This is well above the average performance of 35.4% for our peers.
Our performance this year
The Commission is an independent research and advisory body that does not have a mandate to implement any policies or programmes. One of the ways we assess the impact of our work is through responses by government to recommendations made in our inquiry reports, and independent evaluations of the inquiry process and delivery we undertook to generate our recommendations.
What we do
Our work focuses on undertaking inquiries, conducting research, and promoting understanding on productivity-related matters. By carrying out high quality, innovative research, evidence-based inquiries and promoting understanding of productivity-related topics, we want to:
- explore the contributing factors to the productivity performance of Aotearoa New Zealand
- improve New Zealand’s understanding of what drives higher productivity and wellbeing, and the connection between them
- recommend policies to address those contributing factors.
We also contribute to the work of other organisations by supporting requests for insight and empirical support from the private and public sectors in relation to our past inquiries and research. This can happen years after completion of inquiries and publication of our final reports. We also provide input to government responses to our past inquiries following release of the final report.
Undertaking inquiries and reporting to referring Ministers
Inquiries are significant pieces of analysis and require a deep understanding of a topic. They are typically undertaken over 12 to 15 months. This timeframe recognises the importance of engaging extensively with interested parties and experts to ensure we consider all points of view, obtain the best available information, understand different perspectives, and test ideas. The Government chooses inquiry topics to ensure our work is relevant, and our advice relates to issues that Ministers have an interest in addressing. We are required to act independently in undertaking the inquiries set by the Government.
Conducting and publishing self-directed research
The Commission conducts research and publishes papers to provide an evidence base to offer advice to improve the productivity of Aotearoa New Zealand. This includes benchmarking New Zealand’s productivity performance over time, which is presented in our publication Productivity by the numbers. We collaborate closely with agencies actively working in productivity research. This allows us to access subject/sector specialists and benefit from the latest research and the cross-promotion of ideas and insights.
Promoting public understanding
We undertake a range of communications activities around our inquiries and research work to educate and promote understanding of productivity-related matters. We aim to reach diverse audiences through outreach activities, opinion journalism, and media articles using a range of communication channels including our website and social media.
|
Outcome(s) |
Lift the wellbeing of New Zealand; and, lift New Zealand’s productivity. |
|
Measure |
Volume and quality of formal and informal research output (e.g., inquiry reports, research working paper series, and broader commentary on trends in New Zealand productivity and wellbeing such as our regular Productivity by the numbers report) |
| Assessment method | Location of reporting |
|---|---|
|
A summary of performance evaluation material relevant to the year under review (e.g., expert reviews, surveys, and focus group reports of formal and informal outputs) |
See pages 26-36 |
|
Monitoring and review of Government responses to inquiries and Cabinet minutes, and ongoing follow-up with implementation agencies |
See page 28 |
|
Monitoring of media (including social media) commentary on formal and informal outputs |
See pages 3, 23–25, 29 |
|
Monitoring of Hansard, Select Committee reports and citation tools on formal and informal outputs |
See pages 3, 29 |
As part of our usual evaluation process, we undertook a post-inquiry evaluation on the final report and processes for our A Fair Chance for All inquiry. The results from this review have been included in our performance measures for this reporting period. We have included a comparison with the last year’s report, which covered the Immigration inquiry.
Independent expert review consultant, Dr Ruth Fischer-Smith conducted and reviewed the responses from focus groups, interviews with expert reviewers and survey participants.
The survey participants represented government officials, industry groups, businesses, iwi, academics, NGOs, social service providers and individuals, who had either engaged with the inquiry process through submissions, meetings, webinars or reading the final report. It was pleasing to see that 66% of survey participants had not engaged with the Commission previously. This shows the progress we have made in broadening the reach of our work.
- 146 survey participants
- 66% had not engaged with the Commission previously.
Impact indicators of our work
In this reporting period we received interim responses from the Government to our Immigration: Fit for the future inquiry report (April 2023), and our A Fair Chance for All: Breaking the cycle of persistent disadvantage inquiry report (September 2023). Formal responses for both reports are expected in 2024. To appropriately measure the impact of these inquiries on policy and behaviour change, we need to await full responses from the Government. Although we received a full response from the Government to our Frontier Firms follow-on review, this is not captured in the measures for this reporting period as it was not a full inquiry.
Impact indicator: Policies and behaviours change as a result of the Commission’s work
|
Measure |
Assessment 2021/22 |
Assessment 2022/23 |
|---|---|---|
|
Commission recommendations are explored, agreed, and implemented: |
Awaiting full response from Government. |
Awaiting full response from Government. |
|
How fully were the recommendations implemented or actively explored by the relevant policy makers? |
Awaiting full response from Government. |
Awaiting full response from Government. |
|
Understanding of productivity-related matters increases: |
46% by a little 35% by a lot |
50% by a little 37% by a lot |
1 The Commission can only inform and influence, we do not have the mandate, nor the ability to implement the recommendations we make following our inquiries.
Impact indicator: Generating discussion and debate2
| Measure | Assessment 2021/22 (All Commission work) | Assessment 2022/23 (All Commission work) |
|---|---|---|
|
Third party commentary on reports in the media: |
||
|
Generally positive sentiment.3 |
See Figure 3 below. |
|
817 mentions in the media. |
528 mentions in the media.4 |
|
Top five sources were:
|
Top five sources were:
|
|
Citing of the Commission’s work in Parliament, Select Committees, or in academic or other literature. |
The Commission was mentioned 13 times in Hansard reporting during this reporting period. We have no record of the Commission’s work cited in Select Committees or in academic or other literature during this period. |
The Commission was mentioned 21 times in Hansard reporting during this reporting period. We have no record of the Commission’s work cited in Select Committees or in academic or other literature during this period.5 |
2 We are reporting engagement for the Commission across the full year, including mentions of specific reports and inquiries.
3 In 2021/22 we did not capture the nature of the sentiment for each mention, sentiment was assessed at an aggregated level.
4 The perceived discrepancy in comparison for this number is due to the timing of the release of A Fair Chance for All inquiry report (just prior to the end of the 2022/23 reporting period), and the way the mentions were ‘filtered’ for inclusion this reporting period ensured they were all genuine mentions of NZPC and our work.
5 We are aware of places where our work is cited but we currently don’t have a tool to accurately capture this.
Figure 3 Nature of third party commentary on reports in the media, Assessment 2022/23

Impact indicator: Levels of engagement and response
| Measure | Assessment 2021/22 (Immigration) |
Assessment 2022/23 (A Fair Chance for All) |
|---|---|---|
|
Productivity analysis and advice improves |
||
|
Inquiry participants surveyed who agreed or strongly agreed that the inquiry helped to set or lift the standard in New Zealand for high-quality analysis and advice on [the topic]. |
6% strongly agreed 55% agreed |
25% strongly agreed 32% agreed |
|
Inquiry participants surveyed who agreed or strongly agreed that they will use the inquiry report as a resource and reference in the future. |
25% strongly agreed 39% agreed |
32% strongly agreed 44% agreed |
|
Measure |
Assessment 2022/23 |
|---|---|
|
Expert reviewer and focus group commentary on the quality of analysis and advice in the inquiry and if they will use the inquiry report as a resource and reference in the future. |
A Fair Chance for All inquiry: Expert review The value of the combined findings in the final report, created a valuable reference document to inform policy making and social change on the drivers behind persistent disadvantage and the public sector mechanisms that can be considered for reducing it. The expert reviewer commented that the A Fair Chance for All “inquiry was viewed positively, welcomed by many for the new information it brought to light, and largely regarded as high quality and analytically sound”, while also noting that the extensive research programme “reduced the knowledge gap in understanding persistent disadvantage”.6 |
|
Expert review commentary on the extent to which the research work:7
|
A Fair Chance for All inquiry: Expert review The breadth and depth of research commissioned to inform the inquiry was named by many as extremely valuable. Not only did this directly enhance the quality of inquiry reports (interim, final and quantitative), but it also provided a public resource to inform future thinking and changes to policy to lift productivity and improve wellbeing. |
6 See pages 23 and 32 of the evaluation report.
7 This will normally be assessed through the biennial evaluation of our economics and research function, which will be reported in the 2023/24 Annual Report. For this report we have interpreted this as relating to research that contributed to the A Fair Chance for All inquiry.
Output Measures
The following measures show the results of a survey and expert review carried out after the completion of our A Fair Chance for All inquiry during the 2022/23 period. We have included a comparison to our previous years’ measures relating to our Immigration inquiry reported in our 2021/22 Annual Report.
Measures for our economics and research function are assessed through a biennial evaluation and out of scope for this reporting period. This will be reported in the 2023/24 Annual Report.
Right focus
Relevance and materiality of inquiry report
|
Inquiry participants surveyed who agreed or strongly agreed that: |
Assessment 2021/22 (Immigration) |
Assessment 2022/23 (A Fair Chance for All) |
|---|---|---|
|
18% strongly agreed 48% agreed |
14% strongly agreed 39% agreed |
|
12% strongly agreed 40% agreed |
14% strongly agreed 38% agreed |
|
22% strongly agreed 43% agreed |
26% strongly agreed 43% agreed |
|
17% strongly agreed 43% agreed |
19% strongly agreed 45% agreed |
Relevance and materiality of paper(s) within the research work reviewed
| Assessment 2022/23 Summary comments from expert review for A Fair Chance for All inquiry |
|---|
|
The review acknowledged that this was quite a different type of inquiry for the Commission – different scope, different processes due to the nature of the topic resulting in a wide range of views. The evaluation broadly supported the inquiry’s ambition to cover system-level change, although views on execution of this differed. The key dynamics (short-termism and power imbalance within the system) were captured well, although some thought this was too broad, and some thought it was too narrow. The intention to cover both economic/longitudinal data and the public management system, while ambitious, was met with questions from all sides, which according to the review “probably meant the balance was about right.” |
Good process management
The extent to which inquiry issues papers, draft reports and final reports, and paper(s) within the research work reviewed was delivered to schedule
|
|
Assessment 2021/22 (Immigration) |
Assessment 2022/23 (A Fair Chance for All) |
|---|---|---|
|
All external milestones communicated in the Commission’s process planning are achieved:
|
All milestones achieved |
All milestones achieved |
Participant satisfaction with the inquiry process
|
Assessment 2021/22 (Immigration) |
Assessment 2022/23 (A Fair Chance for All) |
|
|---|---|---|
|
Inquiry participants surveyed who agreed or strongly agreed that overall, they were satisfied with the Commission’s inquiry process. |
17% strongly agreed 65% agreed |
25% strongly agreed 42% agreed |
|
Assessment 2022/23 Summary comments from expert review and focus group for A Fair Chance for All inquiry |
|---|
|
The inquiry team was seen to have tried a range of new things in its inquiry process due to the different nature of the inquiry topic. Overall, the reviewer was satisfied with the processes used to deliver the inquiry. They felt the team had pulled together well despite major challenges across several dimensions, including staff turnover, technology issues within the Commission and within partner agencies, resulting in time and resource constraints. These factors impacted capability and capacity of the Commission, and the overall inquiry timing resulted in release of the inquiry report separately from the supporting quantitative report.8 |
Satisfaction with the Commission’s management of research processes
|
Assessment 2021/22 (Biennial evaluation of our economics and research function) |
Assessment 2022/23 (Biennial evaluation of our economics and research function) |
|
|---|---|---|
|
Participants in the Commission’s research processes surveyed, and reviewer commentary, who agreed and strongly agreed that overall, they were satisfied with the Commission’s approach. |
17% strongly agreed 66% agreed |
Out of scope for this reporting period and will be included in the 2023/24 Annual Report. |
8 Please refer to page 14 of the evaluation report.
High quality work
Participant confidence in the Commission’s inquiry findings and recommendations
|
Assessment 2021/22 (Immigration) |
Assessment 2022/23 (A Fair Chance for All) |
|
|---|---|---|
|
Inquiry participants surveyed who considered the following aspects to be of good or excellent quality:
|
18% excellent 44% good |
38% excellent 39% good |
|
11% excellent 45% good |
37% excellent 33% good |
|
Inquiry participants surveyed who agreed or strongly agreed that:
|
19% strongly agreed 58% agreed |
25% strongly agreed 49% agreed |
|
19% strongly agreed 42% agreed |
Not included in survey for the inquiry. |
The degree of reviewer confidence in research findings and conclusions
|
Reviewer commentary indicates the following aspects to be of good or excellent quality:
|
Assessed through biennial evaluation of our economics and research function. Out of scope for this reporting period and will be included in the 2023/24 Annual Report. |
|
Reviewer agreed or strongly agreed that:
|
Assessed through biennial evaluation of our economics and research function. Out of scope for this reporting period and will be included in the 2023/24 Annual Report. |
Effective engagement
Participant perception of the quality of engagement by the Commission
|
Inquiry participants surveyed who agreed or strongly agreed that: |
Assessment 2021/22(Immigration) |
Assessment 2022/23(A Fair Chance for All) |
|---|---|---|
|
36% strongly agreed 46% agreed |
27% strongly agreed 41% agreed |
|
32% strongly agreed 45% agreed |
34% strongly agreed 35% agreed |
|
28% strongly agreed 52% agreed |
34% strongly agreed 45% agreed |
|
20% strongly agreed 42% agreed |
22% strongly agreed 36% agreed |
|
Summary comments from expert review for A Fair Chance for All inquiry Participants felt the engagement was robust and thorough throughout the inquiry. They considered the Commission’s engagement to be authentic, and “not a tick box exercise.” The Commission’s Chair’s approach in public engagements was considered authentic and of high value. Most participants considered there was an impressive spread of engagement types and reach. Consultation on the Terms of Reference was really valued and worked well for stakeholders. However, it may have created an ongoing expectation for high levels of engagement that couldn’t be sustained by the Commission over the life of the inquiry. Pasifika and Māori engagement was seen as positive and key partners saw their voices represented throughout the process and in the final report. The time and money invested in engaging with these communities to inform the inquiry was considered excellent and had lifted the bar for public sector engagement. |
|
|
Participants in Commission research processes surveyed who agreed or strongly agreed that:
|
Assessed through biennial evaluation of our economics and research function. Out of scope for this reporting period and will be included in the 2023/24 Annual Report. |
Engagement meetings held and submissions received
|
Assessment 2021/22 (Immigration) |
Assessment 2022/23 (A Fair Chance for All) |
|
|---|---|---|
|
Number of parties the Commission engaged with during the inquiry, as noted in the final report appendix. |
74 engagement meetings |
149 engagement meetings and wānanga |
|
Number of parties who made submissions during the inquiry, as noted in the final report appendix. |
181 submissions received |
154 submissions received |
Clear delivery of message
Participant perceptions of the effectiveness of the Commission’s communication of inquiry and research findings and recommendations
| Inquiry participants surveyed who agreed or strongly agreed that: |
Assessment 2021/22 (Immigration) |
Assessment 2022/23 (A Fair Chance for All) |
|---|---|---|
|
28% strongly agreed 57% agreed |
23% strongly agreed 59% agreed |
|
36% strongly agreed 55% agreed |
27% strongly agreed 56% agreed |
|
27% strongly agreed 47% agreed |
29% strongly agreed 52% agreed |
|
Summary comments from expert review for A Fair Chance for All inquiry The report was considered coherent, clear, and well-articulated with a good, logical flow. “Given that this was a new area of focus for the Commission, it is rewarding to see the Commission delivered the research findings and recommendations so well.” “The analytical frames used, and the breadth and depth of research commissioned to support the inquiry, were overall seen as high-quality, robust and meaningful.” |
|
|
Reviewer commentary on research papers indicate that:
|
Assessed through biennial evaluation of our economics and research function. Out of scope for this reporting period and will be included in the 2023/24 Annual Report. |
Overall quality
Independent expert evaluation of the overall quality of the inquiry
|
A report evaluating the overall performance of the inquiry from the final inquiry report (considering the focus of the report, process, analysis, engagement, and delivery of message) with recommendations for future improvements. |
Summary comments from expert review for A Fair Chance for All inquiry The reviewer saw the A Fair Chance for All inquiry was a different type of work for the Commission, acknowledging the need for different tools, approaches, and capabilities to really do it justice. Overall, the inquiry was viewed positively, welcomed by many for the new information it brought to light, and largely regarded as high quality and analytically sound. |
Independent expert evaluation of research work
|
A report evaluating the overall quality of the package of research work (taking into account the focus of the research work, process, analysis, engagement and delivery of message) with recommendations for future improvements. |
Assessed through biennial evaluation of our economics and research function. Out of scope for this reporting period and will be included in the 2023/24 Annual Report. |
Focus group evaluation of inquiry9
|
Report from a focus group representative of inquiry participants, facilitated by an independent person with significant experience in inquiry- type work with feedback on the inquiry and recommendations for future improvements (taking into account the focus of the report, process, analysis, engagement, and delivery of message). |
Summary comments from expert review for A Fair Chance for All inquiry Participants saw the nature of this piece of work as an important part of a mindset change in the public sector. They considered the Commission accomplished a good result with a broad topic, took actions to narrow it down (although not everyone agreed with the choices made in descoping). Some comments from survey respondents on the overall quality of the report: “I heartily support the findings and recommendations. I’m not confident about how easily these will find their way into policy, but they certainly set out very key issues and clear recommendations. Thank you for this important work.” “With such a huge issue, scoping the problem down to focus on the Public Management System was always going to create the issue of compartmentalising a massively complex set of problems.” |
Participant evaluation of inquiry
|
Percentage of inquiry participants surveyed who rated the overall quality of the inquiry as good or excellent (considering the focus of the report, process, analysis, engagement, and delivery of message). |
2021/22 (Immigration) 18% excellent 42% good |
2022/23 (A Fair Chance for All) 42% excellent 28% good |
9 Focus groups were carried out as part of the expert review for the A Fair Chance for All inquiry
2022/23 Financial summary
Summary of financial performance
Our full financial statements and accompanying notes are set out later in this report.
We made a $479,000 operating deficit, as summarised below. Please see Note 17 (page 59) for details.
|
|
Actual 2023 $000 |
Budget 2023 $000 |
Actual 2022 $000 |
|---|---|---|---|
|
Financial performance |
|||
|
Revenue |
|||
|
Revenue from the Crown |
5,930 |
5,930 |
5,930 |
|
All other revenue |
55 |
2 |
57 |
|
Total revenue |
5,985 |
5,932 |
5,987 |
|
|
|||
|
Expenses |
|||
|
Personnel costs |
4,528 |
4,255 |
3,399 |
|
All other expenses |
1,936 |
1,677 |
1,625 |
|
Total expenses |
6,464 |
5,932 |
5,024 |
|
Net surplus/(deficit) |
(479) |
0 |
963 |
|
|
|||
|
Financial position |
|||
|
Assets |
|||
|
Total current assets |
3,106 |
3,368 |
3,540 |
|
Total non-current assets |
138 |
82 |
92 |
|
Total assets |
3,244 |
3,450 |
3,632 |
|
|
|||
|
Liabilities |
|||
|
Total current liabilities |
606 |
562 |
505 |
|
Total non-current liabilities |
88 |
75 |
98 |
|
Total liabilities |
694 |
637 |
603 |
|
Total equity |
2,550 |
2,813 |
3,029 |
Output funding and costs
The Commission’s summary of output funding and costs include the direct and indirect costs associated with delivering our core services: undertaking inquiries, conducting research, and promoting understanding. Dividing our funding in this way allows the Government to determine, at a high level, the mix of our work.
|
|
Actual 2023 $000 |
Budget 2023 $000 |
Actual 2022 $000 |
|
Inquiries |
|||
|
Revenue from the Crown* |
5,189 |
5,189 |
5,189 |
|
Other revenue |
48 |
2 |
50 |
|
Total revenue |
5,237 |
5,191 |
5,239 |
|
Expenses |
(5,714) |
(5,191) |
(4,550) |
|
Net surplus/(deficit) |
(477) |
- |
689 |
|
|
|||
|
Research and promoting understanding |
|||
|
Revenue from the Crown* |
741 |
741 |
741 |
|
Other revenue |
7 |
- |
7 |
|
Total revenue |
748 |
741 |
748 |
|
Expenses |
(750) |
(741) |
(474) |
|
Net surplus/(deficit) |
(2) |
- |
274 |
|
|
|||
|
Total outputs |
|||
|
Revenue from the Crown* |
5,930 |
5,930 |
5,930 |
|
Other revenue |
55 |
2 |
57 |
|
Total revenue |
5,985 |
5,932 |
5,987 |
|
Expenses |
(6,464) |
(5,932) |
(5,024) |
|
Net surplus/(deficit) |
(479) |
- |
963 |
* Revenue from the Crown represents the appropriation received by the Commission and equals the Government’s actual expenses incurred in relation to the appropriation, which is a required disclosure from the Public Finance Act.
End of year reporting requirements as per the Estimates of Appropriations 2022/23 (Finance and Government Administration Sector)
The Commission receives funding from the appropriation “Inquiries and Research into Productivity-Related Matters” under Vote Finance. The Commission’s appropriation is limited to undertaking inquiries, conducting research, and promoting understanding of productivity-related matters by the New Zealand Productivity Commission in accordance with the New Zealand Productivity Commission Act 2010.
|
Assessment of performance |
2022/23 Budget standard |
2022/23 Actual and 2021/22 Actual |
|---|---|---|
|
Inquiry participants’ feedback (via survey) on whether the inquiry helped set or lift the standard in New Zealand for high quality analysis and advice on the topic. |
Maintained |
As reported in the Statement of Performance impact indicator: “Levels of engagement and response” (page 30) |
|
Inquiry participants’ feedback (via survey) on whether the inquiry has increased their understanding of the topic. |
Maintained |
As reported in the Statement of Performance impact indicator: “Policies and behaviours change as a result of the Commission’s work” (page 28) |
|
Successful completion of an annual benchmarking exercise to track New Zealand’s productivity performance. |
Achieved |
Achieved – Productivity by the numbers published. |
|
Successful completion of biennial evaluation of the quality of our research and analysis. |
Maintained |
This was completed and reported on in the last Annual Reporting period. The next one is due in 2024. |
Statement of responsibility for the year ended 30 June 2023
Under the requirements specified in the Crown Entities Act 2004, section 155, the Commission’s Board is responsible for:
- The preparation of the Commission’s financial statements and statement of performance and the judgements made in them
- Any end-of-year performance information provided by the Commission under section 19A of the Public Finance Act 1989
- Establishing and maintaining a system of internal control designed to provide reasonable assurance as to the integrity and reliability of the Commission’s financial and non-financial reporting.
In the Board’s opinion these financial statements and statement of performance fairly reflect the financial position and operations of the Commission for the year ended 30 June 2023.
Signed on behalf of the Board:
Ganesh Nana
Chair
and
Bill Rosenberg
Commissioner & Assurance Committee Chair
Date: 31 October 2023
Independent Auditor’s Report
To the readers of New Zealand Productivity Commission’s financial statements and performance information for the year ended 30 June 2023
The Auditor-General is the auditor of New Zealand Productivity Commission (the Commission). The Auditor-General has appointed me, Kelly Rushton, using the staff and resources of Audit New Zealand, to carry out the audit of the financial statements and the performance information, including the performance information for appropriations, of the Commission on his behalf.
Opinion
We have audited:
- the financial statements of the Commission on pages 45 to 59, that comprise the statement of financial position as at 30 June 2023, the statement of comprehensive revenue and expense, statement of changes in equity and statement of cash flows for the year ended on that date and the notes to the financial statements including a summary of significant accounting policies and other explanatory information; and
- the performance information which reports against the Commission’s statement of performance expectations and appropriations for the year ended 30 June 2023 on pages 11 to 14, 26 to 36, 38 and 39.
In our opinion:
- the financial statements of the Commission:
- present fairly, in all material respects:
- its financial position as at 30 June 2023; and
- its financial performance and cash flows for the year then ended; and
- comply with generally accepted accounting practice in New Zealand in accordance with Public Benefit Entity Reporting Standards Reduced Disclosure Regime; and
- the Commission’s performance information for the year ended 30 June 2023:
- presents fairly, in all material respects, for each class of reportable outputs:
- its standards of delivery performance achieved as compared with forecasts included in the statement of performance expectations for the financial year; and
- its actual revenue and output expenses as compared with the forecasts included in the statement of performance expectations for the financial year;
- presents fairly, in all material respects, for the appropriations:
- what has been achieved with the appropriations; and
- the actual expenses or capital expenditure incurred as compared with the expenses or capital expenditure appropriated or forecast to be incurred; and
- complies with generally accepted accounting practice in New Zealand.
Our audit was completed on 31 October 2023. This is the date at which our opinion is expressed.
The basis for our opinion is explained below. In addition, we outline the responsibilities of the Board and our responsibilities relating to the financial statements and the performance information, we comment on other information, and we explain our independence.
Basis for our opinion
We carried out our audit in accordance with the Auditor-General’s Auditing Standards, which incorporate the Professional and Ethical Standards and the International Standards on Auditing (New Zealand) issued by the New Zealand Auditing and Assurance Standards Board. Our responsibilities under those standards are further described in the Responsibilities of the auditor section of our report.
We have fulfilled our responsibilities in accordance with the Auditor-General’s Auditing Standards.
We believe that the audit evidence we have obtained is sufficient and appropriate to provide a basis for our audit opinion.
Responsibilities of the Board for the financial statements and the performance information
The Board is responsible on behalf of the Commission for preparing financial statements and performance information that are fairly presented and comply with generally accepted accounting practice in New Zealand. The Board is responsible for such internal control as it determines necessary to enable it to prepare financial statements and performance information that are free from material misstatement, whether due to fraud or error.
In preparing the financial statements and the performance information, the Board is responsible on behalf of the Commission for assessing the Commission’s ability to continue as a going concern. The Board is also responsible for disclosing, as applicable, matters related to going concern and using the going concern basis of accounting, unless there is an intention to merge or to terminate the activities of the Commission, or there is no realistic alternative but to do so.
The Board’s responsibilities arise from the Crown Entities Act 2004 and the Public Finance Act 1989.
Responsibilities of the auditor for the audit of the financial statements and the performance information
Our objectives are to obtain reasonable assurance about whether the financial statements and the performance information, as a whole, are free from material misstatement, whether due to fraud or error, and to issue an auditor’s report that includes our opinion.
Reasonable assurance is a high level of assurance, but is not a guarantee that an audit carried out in accordance with the Auditor-General’s Auditing Standards will always detect a material misstatement when it exists. Misstatements are differences or omissions of amounts or disclosures, and can arise from fraud or error. Misstatements are considered material if, individually or in the aggregate, they could reasonably be expected to influence the decisions of readers, taken on the basis of these financial statements and the performance information.
For the budget information reported in the financial statements and the performance information, our procedures were limited to checking that the information agreed to the Commission’s statement of performance expectations.
We did not evaluate the security and controls over the electronic publication of the financial statements and the performance information.
As part of an audit in accordance with the Auditor-General’s Auditing Standards, we exercise professional judgement and maintain professional scepticism throughout the audit. Also:
- We identify and assess the risks of material misstatement of the financial statements and the performance information, whether due to fraud or error, design and perform audit procedures responsive to those risks, and obtain audit evidence that is sufficient and appropriate to provide a basis for our opinion. The risk of not detecting a material misstatement resulting from fraud is higher than for one resulting from error, as fraud may involve collusion, forgery, intentional omissions, misrepresentations, or the override of internal control.
- We obtain an understanding of internal control relevant to the audit in order to design audit procedures that are appropriate in the circumstances, but not for the purpose of expressing an opinion on the effectiveness of the Commission’s internal control.
- We evaluate the appropriateness of accounting policies used and the reasonableness of accounting estimates and related disclosures made by the board.
- We evaluate the appropriateness of the performance information which reports against the Commission’s statement of performance expectations and appropriations.
- We conclude on the appropriateness of the use of the going concern basis of accounting by the Board and, based on the audit evidence obtained, whether a material uncertainty exists related to events or conditions that may cast significant doubt on the Commission’s ability to continue as a going concern. If we conclude that a material uncertainty exists, we are required to draw attention in our auditor’s report to the related disclosures in the financial statements and the performance information or, if such disclosures are inadequate, to modify our opinion. Our conclusions are based on the audit evidence obtained up to the date of our auditor’s report. However, future events or conditions may cause the Commission to cease to continue as a going concern.
-
We evaluate the overall presentation, structure and content of the financial statements and the performance information, including the disclosures, and whether the financial statements and the performance information represent the underlying transactions and events in a manner that achieves fair presentation.
We communicate with the Board regarding, among other matters, the planned scope and timing of the audit and significant audit findings, including any significant deficiencies in internal control that we identify during our audit.
Our responsibilities arise from the Public Audit Act 2001.
Other information
The Board is responsible for the other information. The other information comprises the information included on pages 1 to 10, 15 to 25, 37, and 40, but does not include the financial statements and the performance information, and our auditor’s report thereon.
Our opinion on the financial statements and the performance information does not cover the other information and we do not express any form of audit opinion or assurance conclusion thereon.
In connection with our audit of the financial statements and the performance information, our responsibility is to read the other information. In doing so, we consider whether the other information is materially inconsistent with the financial statements and the performance information, or our knowledge obtained in the audit, or otherwise appears to be materially misstated. If, based on our work, we conclude that there is a material misstatement of this other information, we are required to report that fact. We have nothing to report in this regard.
Independence
We are independent of the Commission in accordance with the independence requirements of the Auditor-General’s Auditing Standards, which incorporate the independence requirements of Professional and Ethical Standard 1: International Code of Ethics for Assurance Practitioners (including International Independence Standards) (New Zealand) (PES 1) issued by the New Zealand Auditing and Assurance Standards Board.
Other than in our capacity as auditor, we have no relationship with, or interests, in the Commission.
Kelly Rushton
Audit New Zealand
On behalf of the Auditor-General Wellington, New Zealand
2022/23 Financial statements
Statement of comprehensive revenue and expense
for the year ended 30 June 2023
|
|
Notes |
Actual 2023 $000 |
Budget 2023 $000 |
Actual 2022 $000 |
|---|---|---|---|---|
|
Revenue |
||||
|
Revenue from the Crown |
1 |
5,930 |
5,930 |
5,930 |
|
Interest revenue |
1 |
55 |
2 |
6 |
|
Other revenue |
1 |
- |
- |
51 |
|
Total revenue |
|
5,985 |
5,932 |
5,987 |
|
|
||||
|
Expenses |
||||
|
Personnel costs |
2 |
4,528 |
4,255 |
3,399 |
|
Other expenses |
3 |
1,904 |
1,632 |
1,594 |
|
Depreciation and amortisation expense |
6,7 |
32 |
45 |
31 |
|
Total expenses |
|
6,464 |
5,932 |
5,024 |
|
Net surplus/(deficit) and total comprehensive revenue and expense |
|
(479) |
- |
963 |
The accompanying notes form part of these financials. Explanations of major variances from budget are provided in note 17.
Statement of changes in equity
for the year ended 30 June 2023
|
|
Note |
Actual 2023 $000 |
Budget 2023 $000 |
Actual 2022 $000 |
|---|---|---|---|---|
|
Balance at 1 July |
|
3,029 |
2,813 |
2,066 |
|
Total comprehensive revenue and expense |
|
(479) |
- |
963 |
|
Balance at 30 June |
12 |
2,550 |
2,813 |
3,029 |
The accompanying notes form part of these financial statements. Explanations of major variances from budget are provided in note 17.
Statement of financial position
as at 30 June 2023
|
|
Notes |
Actual 2023 $000 |
Budget 2023 $000 |
Actual 2022 $000 |
|---|---|---|---|---|
|
Assets |
||||
|
Current assets |
||||
|
Cash and cash equivalents |
4 |
2,995 |
3,332 |
3,450 |
|
Debtors and other receivables |
5 |
111 |
36 |
90 |
|
Total current assets |
|
3,106 |
3,368 |
3,540 |
|
|
||||
|
Non-current assets |
||||
|
Property, plant and equipment |
6 |
127 |
81 |
75 |
|
Intangible assets |
7 |
11 |
1 |
17 |
|
Total non-current assets |
|
138 |
82 |
92 |
|
Total assets |
|
3,244 |
3,450 |
3,632 |
|
|
||||
|
Liabilities |
||||
|
Current liabilities |
||||
|
Creditors and other payables |
8 |
311 |
388 |
310 |
|
Lease incentive |
9 |
12 |
0 |
12 |
|
Employee entitlements |
10 |
283 |
174 |
183 |
|
Total current liabilities |
|
606 |
562 |
505 |
|
|
||||
|
Non-current liabilities |
||||
|
Lease incentive |
9 |
9 |
10 |
22 |
|
Provisions |
11 |
79 |
65 |
76 |
|
Total non-current liabilities |
|
88 |
75 |
98 |
|
Total liabilities |
|
694 |
637 |
603 |
|
Net assets |
|
2,550 |
2,813 |
3,029 |
|
|
||||
|
Equity |
||||
|
Contributed capital |
12 |
500 |
500 |
500 |
|
Accumulated surplus/(deficit) |
12 |
2,050 |
2,313 |
2,529 |
|
Total equity |
|
2,550 |
2,813 |
3,029 |
The accompanying notes form part of these financial statements. Explanations of major variances from budget are provided in note 17.
Statement of cash flows
for the year ended 30 June 2023
|
|
Actual 2023 $000 |
Budget 2023 $000 |
Actual 2022 $000 |
|---|---|---|---|
|
Cash flows from operating activities |
|||
|
Receipts from the Crown |
5,930 |
5,930 |
5,930 |
|
Interest received |
55 |
2 |
6 |
|
Receipts from other revenue |
- |
- |
89 |
|
Payments to suppliers |
(1,925) |
(1,871) |
(1,496) |
|
Payments to employees |
(4,417) |
(4,254) |
(3,379) |
|
Goods and services tax (net) |
(20) |
- |
(20) |
|
Net cash flows from operating activities |
(377) |
(193) |
1,130 |
|
|
|||
|
Cash flows from investing activities |
|||
|
Purchases of property, plant, and equipment |
(78) |
(50) |
(23) |
|
Purchase of intangible assets |
- |
- |
- |
|
Net cash flow from investing activities |
(78) |
(50) |
(23) |
|
|
|||
|
Net increase/(decrease) in cash and cash equivalents |
(455) |
(243) |
1,107 |
|
Cash and cash equivalents at 1 July |
3,450 |
3,575 |
2,343 |
|
Cash and cash equivalents at 30 June |
2,995 |
3,332 |
3,450 |
The accompanying notes form part of these financial statements. Explanations of major variances from budget are provided in note 17.
Reconciliation of net surplus/(deficit) to net cash flow from operating activities
|
|
Actual 2023 $000 |
Actual 2022 $000 |
|---|---|---|
|
Net surplus/deficit |
(479) |
963 |
|
Add/(less) non-cash items |
||
|
Depreciation and amortisation expense |
32 |
31 |
|
Lease make good provision and lease incentive |
(10) |
(7) |
|
Total non-cash items |
22 |
24 |
|
|
||
|
Add/(less) movements in working capital items |
||
|
Debtors and other receivables |
(21) |
11 |
|
Creditors and other payables |
- |
132 |
|
Employee entitlements |
101 |
- |
|
Net movements in working capital items |
80 |
143 |
|
Net cash flow from operating activities |
(377) |
1,130 |
The accompanying notes form part of these financial statements. Explanations of major variances from budget are provided in note 17.
Statement of accounting policies
Reporting entity
The New Zealand Productivity Commission Te Kōmihana Whai Hua o Aotearoa (the Commission) is a Crown entity in terms of the Crown Entities Act 2004. It was established under the New Zealand Productivity Commission Act 2010 and its parent is the Crown. The Commission’s principal activities are to:
- undertake in-depth inquiries on topics referred to it by the Government
- carry out productivity-related research that helps improve productivity over time
- promote public understanding of productivity-related matters.
The Commission is a public benefit entity (PBE) for financial reporting purposes. The financial statements of the Commission are for the year ended 30 June 2023, and were approved by the Board on 31 October 2023.
Basis of preparation
The financial statements have been prepared on a going concern basis, and the accounting policies have been applied consistently throughout the period.
Statement of compliance
The financial statements have been prepared in accordance with the requirements of the Crown Entities Act 2004, which includes the requirement to comply with generally accepted accounting practice in New Zealand (NZ GAAP).
The Commission has applied the suite of Tier 2 Public Benefit Entity International Public Sector Accounting Standards (PBE IPSAS 1 RDR 28-3) in preparing the 30 June 2023 financial statements. The Commission has expenses of less than $30 million.
Measurement base
The financial statements have been prepared on a historical cost basis. Cost is the fair value of the consideration given in exchange for assets.
Functional and presentation currency
The financial statements are presented in New Zealand dollars and all values are rounded to the nearest thousand dollars ($000). The functional currency of the Commission is New Zealand Dollars.
Changes in accounting policies
The International Financial Reporting Interpretations Committee issued an agenda decision whereby a customer does not recognise an intangible asset from customisation and configuration of costs arising from software as a service arrangement if the supplier demonstrates control of the software. The new accounting policy is effective from 1 July 2021 and must be applied retrospectively.
There have not been any implementation costs capitalised from software as a service arrangement, therefore, this change in accounting policy does not have an impact on the Commission.
There have been no other changes in accounting policies during the financial year.
Comparatives
When the presentation or classification of items in the financial statements are amended or accounting policies are changed, comparative figures are restated to ensure consistency with the current period, unless it is impractical to do so.
New Standards adopted
PBE FRS 41 Financial Instruments
In March 2019, the External Reporting Board (XRB) issued PBE IPSAS 41 Financial Instruments, which supersedes both PBE IFRS 9 Financial Instruments and PBE IPSAS 29 Financial Instruments: Recognition and Measurement. The Commission has adopted PBE IPSAS 41 for the first time this year. There has been little change since adopting the new standard because the requirements are similar to those contained in PBE IFRS 9.
Significant accounting policies
The significant accounting policies that materially affect the measurement of financial performance, position and cash flows have been applied consistently for all reporting periods covered by these financial statements. The policies satisfy the concepts of relevance and reliability ensuring the substance of the underlying transactions of other events is reported. Significant accounting policies are included in the notes to which they relate.
Goods and services tax
All items in the financial statements are presented exclusive of goods and services tax (GST), except for receivables, which are presented on a GST-inclusive basis. Where GST is not recoverable as input tax, then it is recognised as part of the related asset or expense. The net GST recoverable from, or payable to Inland Revenue (IR) is included as part of receivables or payables in the Statement of Financial Position.
The net GST paid to, or received from IR, including the GST relating to investing and financing activities, is classified as a net operation cash flow in the Statement of Cash Flows.
Income tax
The Commission is a public authority and consequently is exempt from income tax under section CW 38 of the Income Tax Act 2007. Accordingly, no provision has been made for income tax.
Foreign currency transactions
Foreign currency transactions are translated into New Zealand dollars (the functional currency) using the exchange rates prevailing at the dates of the transactions. Foreign exchange gains and losses resulting from the settlement of such transactions and from the translation at year end exchange rates of monetary assets and liabilities denominated in foreign currencies are recognised in the surplus or deficit.
Budget figures
The budget figures are derived from the Statement of Performance Expectations as approved by the Board. The budget figures are unaudited and have been prepared in accordance with NZ GAAP, using accounting policies that are consistent with those adopted by the Board in preparing these financial statements.
Performance outputs
Direct costs are charged directly to outputs. Research personnel costs are allocated to outputs based on the time spent. The indirect costs of support groups and overhead costs are charged to the outputs based on the proportion of direct costs of each output.
Critical accounting estimates and assumptions
In preparing these financial statements the Commission has made estimates and assumptions concerning the future. These estimates and assumptions may differ from the subsequent actual results. Estimates and assumptions are continually evaluated and are based on historical experience and other factors, including expectations of future events that are believed to be reasonable under the circumstances.
Critical judgements in applying accounting principles
Management has exercised the following critical judgements in applying accounting policies:
Leases classification
Determining whether a lease agreement is a finance lease, or an operation lease requires judgement as to whether the agreement transfers substantially all the risks and rewards of ownership to the Commission. Judgement is required on various aspects that include, but are not limited to, the fair value of the leased asset, the economic life of the leased asset, whether to include renewal options in the lease term and determining an appropriate discount rate to calculate the present value of the minimum lease payments. Classification as a finance lease means the asset is recognised in the Statement of Financial Position as property, plant, and equipment, whereas for an operating lease no such asset is recognised. The Commission has exercised its judgement on the appropriate classification of equipment leases and has determined that none of the lease arrangements are finance leases.
Notes to financial statements
Note 1 Revenue
Revenue is measured at a fair value of consideration received or receivable. Revenue is derived through the provision of outputs for the Crown, services to third parties and investment income.
Revenue from the Crown
Revenue from the Crown transactions are considered non-exchange transactions. The Commission is primarily funded through revenue received from the Crown. The funding is restricted in its use for the purpose of the Commission meeting its objectives as specified in its founding legislation and the scope of relevant government appropriations. Apart from these general restrictions, the Commission considers there are no conditions attached to the funding.
Revenue from the Crown is recognised as revenue when earned and is reported in the financial period to which it relates. The fair value of revenue from the Crown has been determined to be equivalent to the amounts due in the funding arrangements.
Interest
Interest revenue is recognised using the effective interest method.
Other revenue
Other revenue transactions are considered exchange transactions. They are personnel costs recovered for employees who work on secondment in other organisations.
Other revenue is recognised as revenue when earned and is reported in the financial period it relates to.
Note 2 Personnel costs
Personnel costs are recognised in the period they relate to.
Superannuation schemes
Defined contribution schemes
Obligations for contributions to KiwiSaver are accounted for as a defined contribution superannuation scheme and are recognised as an expense in the surplus or deficit as incurred.
Defined benefit schemes
The Commission does not make employer contributions to any defined benefit superannuation schemes.
|
|
Actual 2023 $000 |
Actual 2022 $000 |
|---|---|---|
|
Salaried and contractors |
3,638 |
2,583 |
|
Board fees |
598 |
651 |
|
Employer contributions to KiwiSaver defined contribution superannuation plan |
81 |
67 |
|
Other entitlements |
73 |
6 |
|
Bonuses |
- |
5 |
|
Other |
138 |
87 |
|
Total personnel costs |
4,528 |
3,399 |
Key personnel compensation
|
|
Remuneration 2023 $000 |
Full-time equivalent members 2023 |
Remuneration 2022 $000 |
Full-time equivalent members 2022 |
|---|---|---|---|---|
|
Board members |
594 |
1.9 |
648 |
1.9 |
|
Leadership team |
878 |
4 |
803 |
4 |
|
Total key management personnel remuneration |
1,472 |
5.9 |
1,451 |
5.9 |
Key management personnel are Commissioners, Directors.
Board fees
Commissioners are appointed by the Crown and are the Board for the purposes of the Crown Entities Act 2004. All Commissioners are part-time, and their fee is set by the Remuneration Authority.
|
|
Actual 2023 $000 |
Actual 2022 $000 |
|---|---|---|
|
Dr Ganesh Nana (Chair) |
291 |
305 |
|
Dr Bill Rosenberg |
143 |
96 |
|
Dr Diane Ruwhiu |
112 |
- |
|
Gail Pacheco |
48 |
160 |
|
Andrew Sweet |
- |
87 |
|
Total Board member remuneration |
594 |
648 |
During the financial year, payments made, or payable to Lesley Mackle, committee member appointed by the Board, but who is not a Board member, was $4,000 (2022: $4,000).
The Commission has not provided a deed of indemnity to Board members for activities undertaken in the performance of the Commission’s functions. The Commission has not affected Directors’ and Officers’ liability and professional indemnity insurance cover during the financial year in respect of the liability or costs of Board members and employees. No Board or committee members received compensation or other benefits in relation to cessation (2022: Nil).
Note 3 Other expenses
|
|
Actual 2023 $000 |
Actual 2022 $000 |
|---|---|---|
|
Fees to principal auditor for financial statement audit |
39 |
36 |
|
Consultancy |
1,029 |
884 |
|
Information technology and telecommunications |
269 |
218 |
|
Travel and transport |
47 |
20 |
|
Operating lease expense (office rental) |
215 |
208 |
|
Communication and engagement |
70 |
56 |
|
Training and development |
64 |
17 |
|
Other expenses |
171 |
155 |
|
Total other expenses |
1,904 |
1,594 |
Office rental
The non-cancellable operating lease expense relates to the lease of level 15 of Fujitsu Tower in Wellington. The lease expires in March 2025. The Commission as a lessee exercised its right to renew in April 2016 with a rental rebate of $1,031.91 (GST exclusive) per month for 48 months from April 2021. A rental review was completed and applied from October 2021.
As the lessor retains substantially all the risk and rewards of ownership of the leased property, the operating lease payments are recognised in the surplus or deficit only in the period they occur in.
Any lease incentive received or obligations to make good on the condition of the leased premises are recognised in the surplus or deficit over the term of the lease.
The future aggregate minimum lease payments to be paid under non-cancellable operating leases are as follows:
|
|
Actual 2023 $000 |
Actual 2022 $000 |
|---|---|---|
|
Not later than one year |
207 |
207 |
|
Later than one year and not later than five years |
155 |
363 |
|
Total non-cancellable operating leases |
362 |
570 |
Note 4 Cash and cash equivalents
Cash and cash equivalents include operating and savings bank accounts held with Westpac. The carrying value of cash at the bank and cash equivalents approximates fair value. The Commission is only permitted to spend its cash and cash equivalents within the scope and limits of its appropriation.
|
|
Actual 2023 $000 |
Actual 2022 $000 |
|---|---|---|
|
Operating bank account |
455 |
294 |
|
Savings bank account |
2,540 |
3,156 |
|
Total cash and cash equivalents |
2,995 |
3,450 |
Note 5 Debtors and other receivables
Debtors and other receivables are initially measured at fair value and subsequently measured at amortised cost using the effective interest method. The carrying value of debtors and other receivables approximates their fair value.
All trade debtors are due within 30 days. Trade debtors have been assessed for impairment based on expected credit losses. No provision for expected credit losses have been made as at 30 June 2023 (2022: Nil).
|
|
Actual 2023 $000 |
Actual 2022 $000 |
|---|---|---|
|
Receivables – exchange transactions |
||
|
Debtors and other receivables |
- |
- |
|
Prepayments |
55 |
54 |
|
Receivables – non-exchange transactions |
||
|
GST receivable |
56 |
36 |
|
Total debtors and other receivables |
111 |
90 |
Note 6 Property, plant and equipment
Property, plant, and equipment consists of the following asset classes: information technology equipment, furniture, office equipment, and leasehold improvements. The capitalisation thresholds are:
- Information technology equipment - $500 and over
- Furniture - No threshold
- Office equipment - $500 and over
- Leasehold improvements - No threshold
Additions
An item of property, plant and equipment is recognised as an asset only when it is probable that the future economic benefits or service potential associated with the item flow to the Commission beyond one year or more, and the cost of the item can be measured reliably. Property, plant, and equipment is recorded at historical cost less accumulated depreciation and any impairment loss. Depreciation on items of property, plant and equipment acquired in stages does not commence until the item of property, plant and equipment is in its final state and ready for its intended use. Subsequent expenditure that extends the useful life or enhances the service potential of an existing item of property, plant and equipment is capitalised. All other costs incurred in maintaining the useful life or service potential of an existing item of property, plant and equipment are recognised in the surplus or deficit as expenditure when incurred.
Disposals
Gains and losses arising from the sale or disposal of an item of property, plant and equipment are recognised in the surplus or deficit in the period in which the item of property, plant and equipment is sold or disposed of.
Depreciation
Depreciation is provided on a straight-line basis on all asset components to allocate the cost of the asset (less any estimated residual value) over its useful life. The residual values and remaining useful lives of property, plant and equipment are reviewed annually. This review includes a test of impairment to ensure the carrying amount remains recoverable.
Any impairment losses are recognised in the surplus or deficit. The estimated useful lives of the major asset classes are:
- Information technology equipment - 1 to 5 years
- Furniture - 3 to 10 years
- Office equipment - 5 to 10 years
- Leasehold improvements - 3 to 10 years
Leasehold improvements are depreciated over the unexpired period of the lease or the estimated remaining useful lives of the improvements, whichever is shorter. The residual value and useful life of an asset is reviewed, and adjusted if applicable, at each financial year end.
|
|
IT assets $000 |
Furniture $000 |
Office equipment $000 |
Leasehold improvements $000 |
Total $000 |
|---|---|---|---|---|---|
|
Cost or valuation |
|||||
|
Balance at 1 July 2022 |
232 |
128 |
107 |
266 |
733 |
|
Additions |
45 |
27 |
7 |
- |
79 |
|
Disposals |
- |
(20) |
- |
- |
(20) |
|
Balance at 30 June 2023 |
277 |
135 |
114 |
266 |
792 |
|
|
|||||
|
Accumulated depreciation and impairment loss |
|||||
|
Balance at 1 July 2022 |
188 |
122 |
84 |
265 |
659 |
|
Depreciation expense |
17 |
2 |
6 |
1 |
26 |
|
Disposals |
- |
(20) |
- |
- |
(20) |
|
Balance at 30 June 2023 |
205 |
104 |
90 |
266 |
665 |
|
|
|||||
|
Carrying amounts |
|||||
|
At 30 June 2023 |
72 |
31 |
24 |
- |
127 |
|
|
|||||
|
Cost or valuation |
|||||
|
Balance at 1 July 2021 |
217 |
128 |
100 |
266 |
711 |
|
Additions |
18 |
- |
7 |
- |
25 |
|
Disposals |
(3) |
- |
- |
- |
(3) |
|
Balance at 30 June 2022 |
232 |
128 |
107 |
266 |
733 |
|
|
|||||
|
Accumulated depreciation and impairment losses |
|||||
|
Balance at 1 July 2021 |
171 |
121 |
79 |
264 |
635 |
|
Depreciation expense |
18 |
1 |
5 |
1 |
25 |
|
Disposals |
(1) |
- |
- |
- |
(1) |
|
Balance at 30 June 2022 |
188 |
122 |
84 |
265 |
659 |
|
|
|||||
|
Carrying amounts |
|||||
|
At 30 June 2022 |
44 |
7 |
23 |
1 |
75 |
Property, plant and equipment have been assessed for impairment and no provisions for impairment have been made.
Note 7 Intangible assets
Software acquisition
Computer software licences are capitalised on the basis of the costs incurred to acquire and bring to use the specific software. Staff training costs are recognised as an expense when incurred. Costs associated with maintaining computer software are recognised as an expense when incurred. Assets are capitalised if the purchase price is $5,000 or greater.
Amortisation
The carrying value of an intangible asset with a finite life is amortised on a straight-line basis over its useful life. Amortisation begins when the asset is available for use and ceases at the date that the asset is derecognised. The amortisation charge for each financial year is recognised in the surplus or deficit. The Commission’s intangible assets are acquired software with useful life between 3 to 15 years.
|
|
Actual 2023 $000 |
Actual 2022 $000 |
|---|---|---|
|
Cost or valuation |
||
|
Balance at 1 July |
194 |
194 |
|
Additions |
- |
- |
|
Balance at 30 June |
194 |
194 |
|
|
||
|
Accumulated depreciation and impairment losses |
||
|
Balance at 1 July |
177 |
171 |
|
Amortisation expense |
6 |
6 |
|
Balance at 30 June |
183 |
177 |
|
|
||
|
Net carrying amount |
11 |
17 |
Note 8 Creditors and other payables
Creditors and other payables are initially measured at fair value and subsequently measured at amortisation cost using the effective interest method. Creditors and other payables are non-interest bearing and are settled on commercial terms and conditions, normally 30 days or less. Therefore, the carrying value of creditors and other payables approximates their fair value.
|
|
Actual 2023 $000 |
Actual 2022 $000 |
|---|---|---|
|
Payables – exchange transactions |
||
|
Accrued expenses |
252 |
264 |
|
Payables – non-exchange transactions |
||
|
Taxes payable (PAYE) |
52 |
41 |
|
Other payables |
7 |
5 |
|
Total creditors and other payables |
311 |
310 |
Note 9 Lease incentive
Any unamortised lease incentive received is recognised as a liability in the Statement of Financial Position.
|
|
Actual 2023 $000 |
Actual 2022 $000 |
|---|---|---|
|
Current portion |
12 |
12 |
|
Non-current portion |
9 |
22 |
|
Total lease incentive |
21 |
34 |
Note 10 Employee entitlements
At the balance date, any unpaid employee entitlements earned by employees for salaries and annual leave are recognised as a liability in the Statement of Financial Position and recognised in the surplus or deficit. Entitlements are calculated on an actual entitlement basis at current rates of remuneration. The Commission recognises a liability and an expense for bonuses where it is contractually obliged to pay them, or where a past practice has created a constructive obligation. No provision has been made for sick leave as all sick leave is non-vesting and the average sick leave to be taken in future years by Commission employees is estimated to be less than the annual entitlement of sick leave.
The Commission does not offer retirement or long service leave benefits to its employees.
|
|
Actual 2023 $000 |
Actual 2022 $000 |
|---|---|---|
|
Accrued annual leave |
189 |
120 |
|
Accrued salaries and wages |
94 |
63 |
|
Total employee entitlements |
283 |
183 |
Note 11 Provisions
A provision is recognised for future expenditure of uncertain amount or timing when there is a present obligation (either legal or constructive) because of a past event, it is probable that expenditure will be required to settle the obligation, and a reliable estimate can be made of the amount of the obligation.
At the expiry of the lease term the Commission is required to make good any damage caused to its leased office premises, and to remove any fixtures or fittings installed by the Commission. The Commission has the option to renew this lease, which affects the timing of expected cash outflows to make-good the premises. The cash flows associated with provision are expected to occur in March 2025.
Information about the leasing arrangement is disclosed in note 3.
|
|
Actual 2023 $000 |
Actual 2022 $000 |
|---|---|---|
|
Lease make-good |
||
|
Non-current portion |
79 |
76 |
|
Total provisions |
79 |
76 |
Movement within the provision:
|
|
Actual 2023 $000 |
Actual 2022 $000 |
|---|---|---|
|
Balance at 1 July |
76 |
71 |
|
Additional provisions made |
3 |
5 |
|
Balance at 30 June |
79 |
76 |
Note 12 Equity
Equity is measured as the difference between total assets and total liabilities. Equity is disaggregated and classified into the following components:
- contributed capital
- accumulated surplus / (deficit)
The Commission is subject to the financial management and accountability provisions of the Crown Entities Act 2004, which impose restrictions in relation to borrowings, acquisition of securities, issuing guarantees and indemnities, and the use of derivatives. The Commission manages its equity as a by-product of prudently managing revenues, expenses, assets, liabilities, investments, and general financial dealings to ensure the Commission effectively achieves its objectives and purpose, while remaining a going concern.
|
|
Actual 2023 $000 |
Actual 2022 $000 |
|---|---|---|
|
Balance at 1 July |
3,029 |
2,066 |
|
Surplus/(deficit) for the year |
(479) |
963 |
|
Balance at 30 June |
2,550 |
3,029 |
Note 13 Contingencies
The Commission has no contingent liabilities and no contingent assets as at 30 June 2023 (2022: Nil).
Note 14 Events after the balance date
There were no significant events after balance date (2022: Nil).
Note 15 Financial instruments
|
|
Actual 2023 $000 |
Actual 2022 $000 |
|---|---|---|
|
Financial assets held at amortised costs |
||
|
Cash and cash equivalents |
2,995 |
3,450 |
|
Debtors and other receivables |
- |
- |
|
Total financial assets held at amortised cost |
2,995 |
3,450 |
|
|
||
|
Financial liabilities measured at amortised cost |
||
|
Creditors and payables |
258 |
269 |
|
Total financial liabilities measured at amortised cost |
258 |
269 |
Financial instrument risks
The Commission is a party to financial instrument arrangements as part of its everyday operations. These financial instruments include bank accounts, accounts receivable, and accounts payable. The Commission has policies to manage the risks associated with financial instruments. The Commission seeks to minimise exposure from financial instruments and does not enter into speculative financial instrument transactions.
Market risk
Interest rate risk
Fair value interest rate risk is the risk that the value of a financial instrument will fluctuate due to changes in market interest rates.
Cash flow interest rate risk is the risk that cash flows from a financial instrument will fluctuate because of changes in market interest rates. The Commission’s exposure to cash flow interest rate risk is limited to on-call bank accounts and short-term deposits, arising from the investment of surplus cash due to the timing of cash inflows and outflows.
Credit risk
Credit risk is the risk that a third party will default on its obligation to the Commission, causing it to incur a loss. The Commission invests surplus cash with registered banks. In the normal course of business, the Commission is exposed to credit risk from cash and term deposits with banks, debtors, and other receivables. For each of these, the maximum credit exposure is best represented by the carrying amount in the Statement of Financial Position. Westpac Banking Corporation is the Commission’s main bank and has a S&P Global Ratings of AA-.
Liquidity risk
Management of liquidity risk
Liquidity risk is the risk that the Commission will encounter difficulty raising liquid funds to meet commitments as they fall due.
The Commission has a low exposure to liquidity risk as it does not enter into credit arrangements, except for those available from suppliers as part of normal operating agreements. The Commission manages liquidity risk by continuously monitoring forecast and actual cash flow requirements and aims to maintain sufficient funds in current and on-call bank accounts and short-term fixed deposits to meet forecast liquidity requirements.
Note 16 Related party transactions
The Commission is a wholly owned entity of the Crown. Related party disclosures have not been made for transactions with related parties that are within a normal supplier or client/recipient relationship on terms and conditions no more or less favourable than those that is reasonable to expect the Commission would have adopted in dealing with the party at arm’s length in the same circumstances. Further, transactions with other government agencies (for example, Government departments and Crown entities) are not disclosed as related party transactions when they are consistent with the normal operating arrangements between government agencies and undertaken on the normal terms and conditions for such transactions.
Key personnel
Commissioners are appointed by the Crown and are the Board for the purposes of the Crown Entities Act 2004. In addition to their role with the Commission, Commissioners have other interests and may serve in positions with other organisations, including organisations to which the Commission is related. Potential conflicts of interest are declared in an interests register.
No Commissioner was exempted during the year from the requirement to not vote or take part in any decision despite being interested.
Refer to note 2 for a breakdown of key management personnel compensation.
Note 17 Explanation of major variances against budget
The net deficit for the Commission from 1 July 2022 to 30 June 2023 was $479,000 (2021-22: net surplus of $963,000). In terms of the deficit of $479,000. The key area of overspend was $612,000 in professional services i.e., consultancy and contracting due to one-off expenditure for recruitment, strategic projects, and organisational development activity. This is partially offset with an underspend of $120,000 in personnel due to vacancies.
The planned overspend was forecasted and confirmed with Treasury in early 2023. No costs relating to this overspend were for on-going costs outside of this financial year.
Employee remuneration
|
|
Number of employees 2023 |
Number of employees 2022 |
|---|---|---|
|
$100,000 – 109,999 |
- |
3 |
|
$110,000 – 119,000 |
1 |
1 |
|
$120,000 – 129,000 |
- |
2 |
|
$130,000 – 139,000 |
- |
2 |
|
$140,000 – 149,000 |
1 |
- |
|
$150,000 – 159,000 |
2 |
- |
|
$160,000 – 169,000 |
1 |
- |
|
$170,000 – 179,000 |
2 |
2 |
|
$180,000 – 189,000 |
2 |
1 |
|
$190,000 – 199,000 |
1 |
- |
|
$200,000 – 209,000 |
1 |
1 |
|
$210,000 – 219,000 |
1 |
- |
|
$220,000 – 229,000 |
2 |
- |
|
Total employees |
14 |
12 |